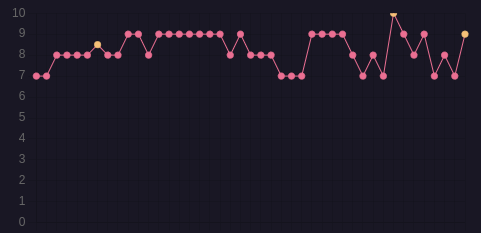
I have a line graph of arbitrary values given as YAML properties in my daily notes.
I am trying to make it so on click of any of these dots, it will take me to the associated daily note. I have been searching for a few hours, and making no progress. I can run javascript for each node clicked (i.e. successfully print out the path of the .md file I want to open), but I have no idea how, if possible, to have obsidian open a .md file for you.
Does anyone know if there is a builtin way to do this using dataviewjs? Or will I have to use another plugin, and what would you recommend? Thank you.
If you were able to display the file path by clicking on a dot, I think it will be quite possible to open the file.
For example, I think the easiest way is to use a uri with window.open('obsidian://open?vault=my%20vault&file=my%20note').
Can you share the code you use to create the graph with the possibility of clicking on a point?
Thank you so much, that actually totally worked! I figured it would be something like that. I tried a few different URI schemes and couldn’t figure out the right one, so i gave up on window.open. This is my finished code for reference (each daily note of mine has two YAML properties; number, a number, and checkbox, a checkbox). This code could definitely be improved but works fine for now.
// Fair amount of code """borrowed""" from https://obsidian.rocks

const path = '"Notes/2024"';
const dateFormat = 'YYYY-MM-DD'

let links = [];
let data = [];
let colors = [];

let sortByName = ((a, b) => moment(a, dateFormat).format('YYYYMMDD') - moment(b, dateFormat).format('YYYYMMDD'));

let latest_entries = dv.pages(path).sort(e => e.file.name, 'asc', sortByName);

for (let i = 0; i < latest_entries.length; i++) {
	let e = latest_entries[i];
	if (e.number != undefined) {
		data.push(e.number);
		links.push(e.file.link);
		if (e['checkbox']) {
			colors.push(getComputedStyle(document.body)
				.getPropertyValue('--h2-color'));
		} else {
			colors.push(getComputedStyle(document.body)
				.getPropertyValue('--h1-color'));
		}
	}
}

const lineChart = {
	type: 'line',
	data: {
		labels: links.map((x) => x.fileName()),
		datasets: [{
			label: 'Data over Time',
			data: data,
			backgroundColor: colors,
			borderColor: colors,
			borderWidth: 1,
		}],
		yMin: 0,
		yMax: 10
	},
	options: {
		plugins: {
			legend: {
				display: false
			}
		},
		scales: {
			x: {
				ticks: {
					display: false
				}
			},
			y: {
				min: 0,
				max: 10
			}
		},
		onClick: (e, element) => {
			let vault = app.vault.getName();
			let file = links[element[0].index].path;
			window.open(`obsidian://open?vault=${vault}&file=${file}`);
		}
	}
}

window.renderChart(lineChart, this.container);