DataViewJS: Group table rows similar to excel

Hi everybody,

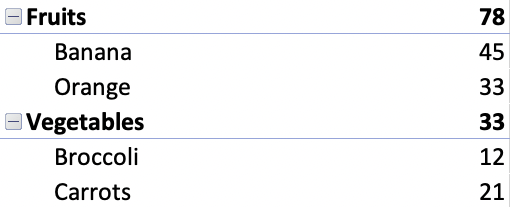
I am trying to create subgroups for rows in a table similar to the layout of pivot tables in Excel (see screenshot)
Prefered_Layout

At the moment I am using the following code below to create a flat table with dataviewjs. Does anyone of you know of a way to insert subgroups into this flat table, similar to the attached screenshot.

Any help is appreciated.

let myArray = []
myArray = dv.array(myArray);
let obj1 = { top: "Vegetables", Sub: "Broccoli", Amount: "12.00"};
let obj2 = { top: "Vegetables", Sub: "Carrots", Amount: "21.00"};
let obj3 = { top: "Fruits", Sub: "Orange", Amount: "33.00"};
let obj4 = { top: "Fruits", Sub: "Banana", Amount: "45.00"};

myArray["values"].push(obj1);
myArray["values"].push(obj2);
myArray["values"].push(obj3);
myArray["values"].push(obj4);

dv.table(
    ["Vegetables", "Sub", "Amount"],
    myArray.map((a) => [a.top, a.Sub, a.Amount])
);

The closest variant I believe is to replace your call to dv.table() with this one:

dv.table(["Vegetables", "Sub", "Amount"],
   myArray
     .groupBy(a => a.top)
     .map((a) => [a.key, a.rows.Sub, a.rows.Amount])
)

Which has this output:
image

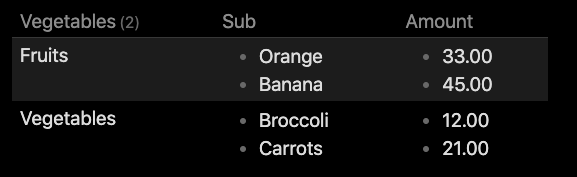
However, the groups are not collapsible, and you’re not totally safe that the groups are corresponding inbetween their list items. In most cases, it should be alright though.

You could, if you really need to collapse stuff, exchange the dv.table() call with a list traversing where you output the key as a header, and present the other values in a table under that header. (However, there is an issue with dataview not allowing headers to be collapsed when output by dataviewjs, so then we’re back to square one)

This topic was automatically closed 90 days after the last reply. New replies are no longer allowed.