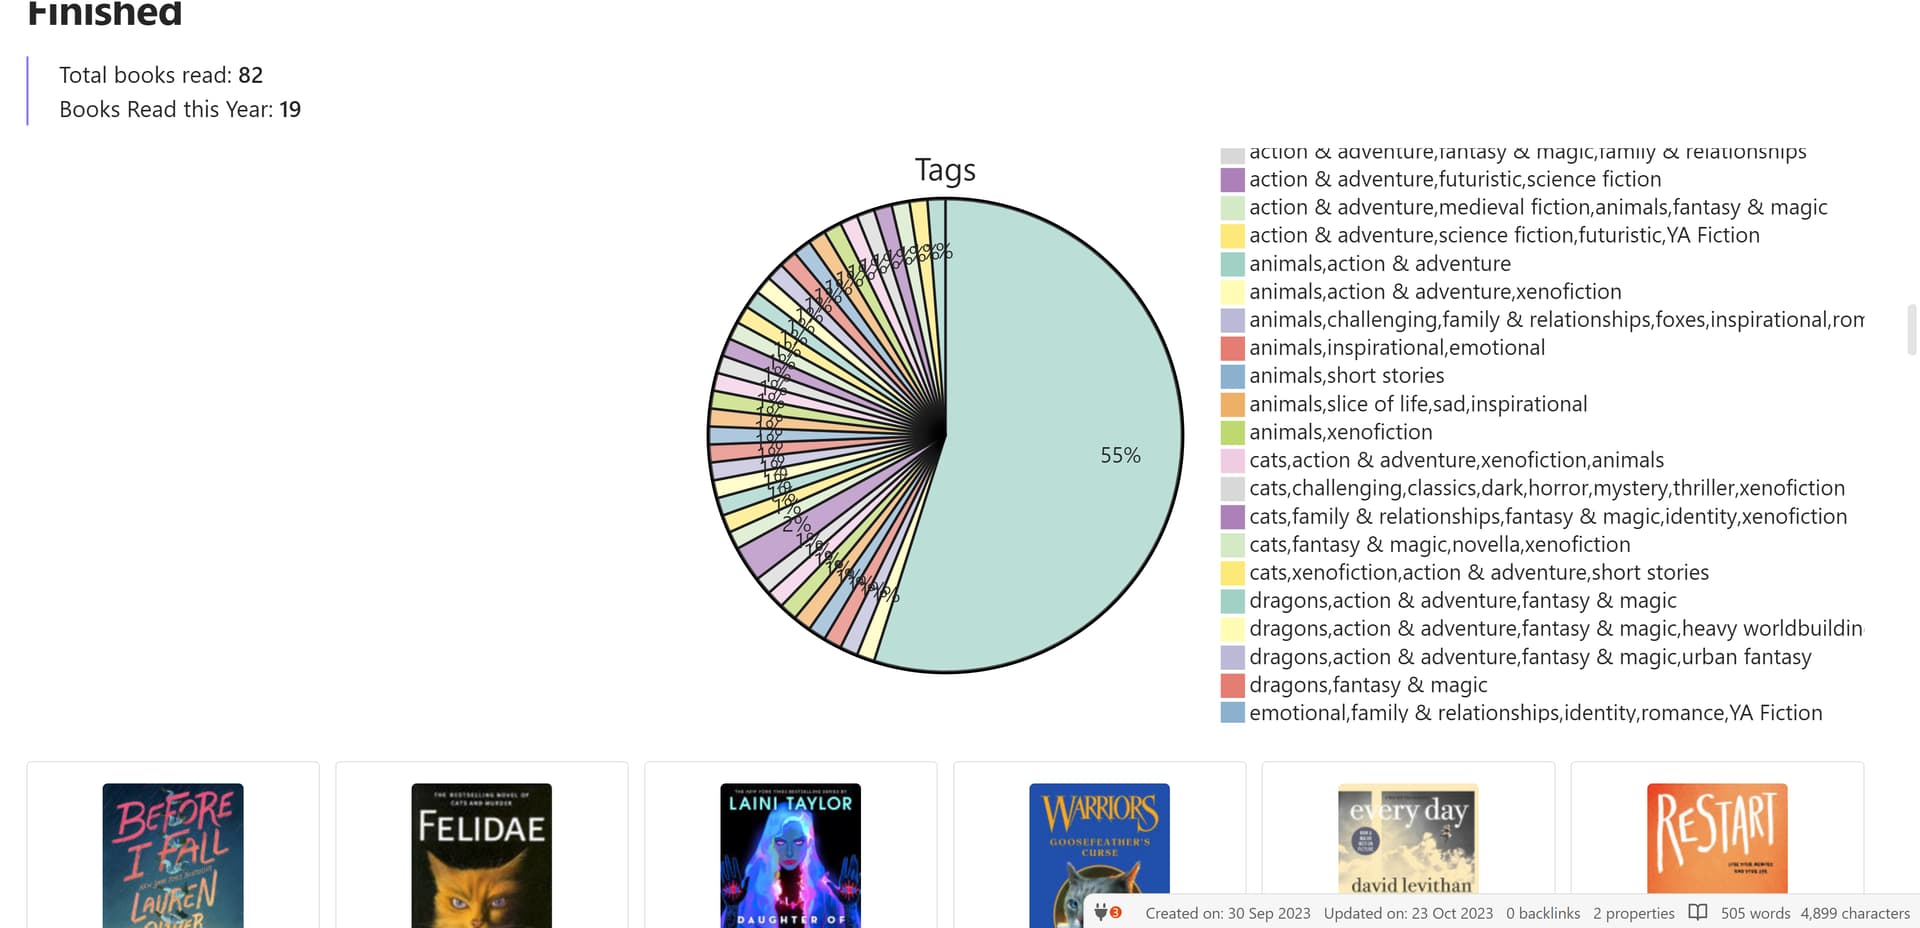
And I want to have a graph that gives me percentages for each of these “subjects” individually. For example, I’m sure at least 30% of the books I’ve read have cats as a value for subject.
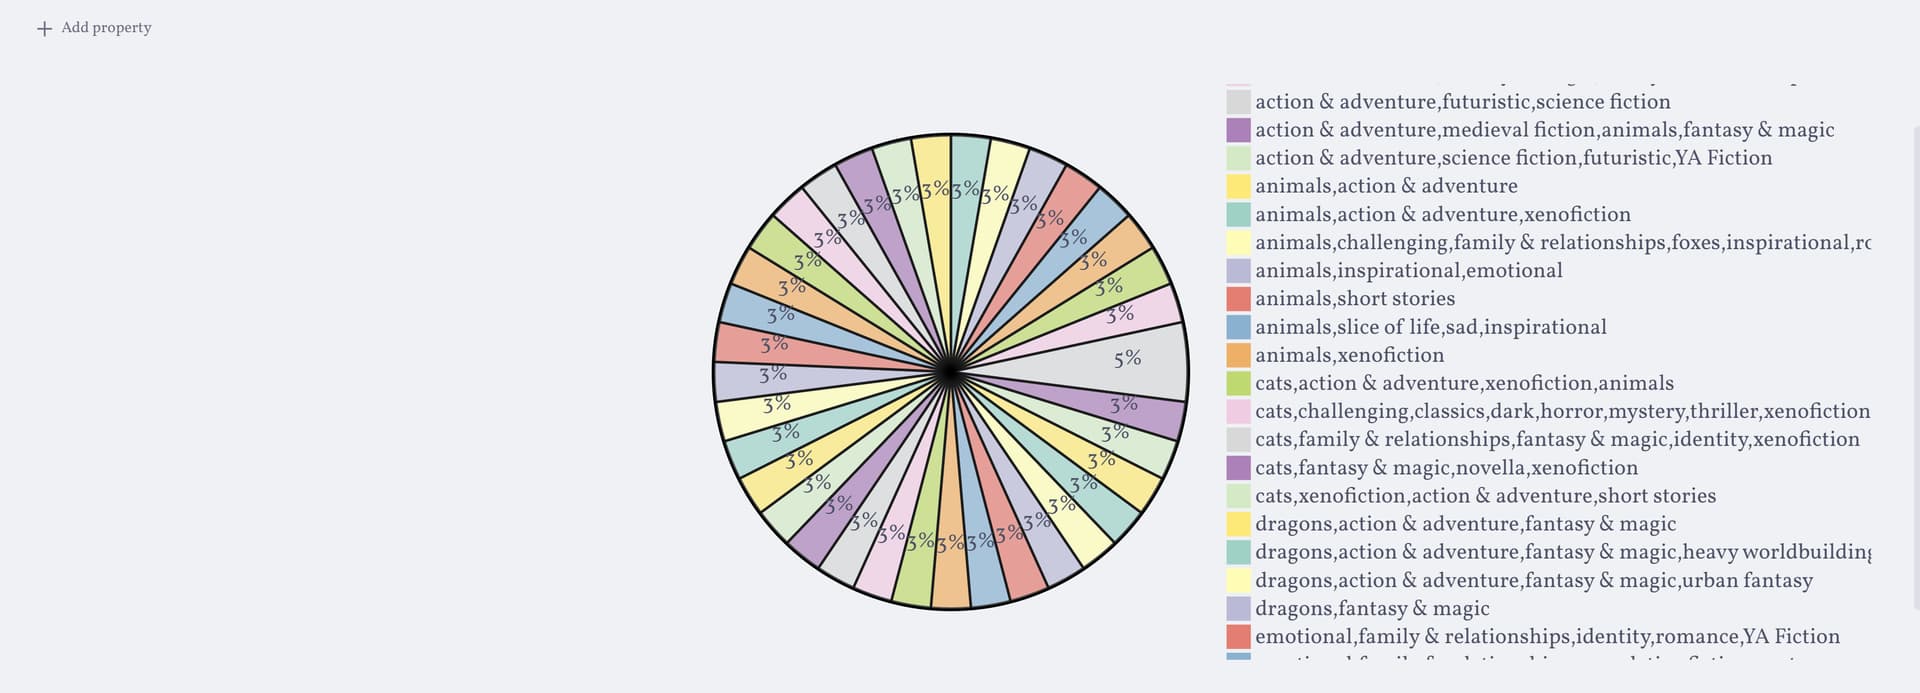
But instead I get veeery narrow pie slices because the lists are treated as full strings rather than individual values.
Do you know this can be achieved?
I have a faint idea in my head of iterating through each book’s subjects and counting each one as an instance of the book, and then using that to calculate the value, if you understand what I mean. However, I am not very skilled in Javascript, so I have no idea as to how I would do that.
Things I have tried
This is my current code in the picture:
let pages = dv.pages().where(p => p.status == "read" || p.status == "#read"); // only get books I have read already
let graphText = ""; // declare variable for use in the pie chart graph later

// I sort of copied this from someone, but the big idea:  produces the subject values and corresponding total counts, then formats it for the pie chart.
for (let group of pages.groupBy(b => b.subject)) {
   graphText += `"${group.key}" : ${Math.round(group.rows.file.name.length)}
   `;
}

// mermaid pie chart graph output
dv.paragraph(`
~~~mermaid
pie title Tags
 ${graphText}
 ~~~
 `)
If you decide to help me out, thanks; I really appreciate it, because I love pie graphs and my Javascript is pathetic.
let pages = dv.pages().where(p => p.status == "read" || p.status == "#read").where(p => p.subject); // only get books I have read already, where subject isn't empty
let graphText = ""; // declare variable for use in the pie chart graph later

//  produce the subject values and corresponding total counts, then formats it for the pie chart.

for (let group of pages.groupBy(b => Array(b.subject).flat())) { // ADDED .flat function
   graphText += `"${group.key}" : ${Math.round(group.rows.file.name.length)}

   `;
}

// mermaid pie chart graph output
dv.paragraph(`
~~~mermaid
pie

 ${graphText}
 ~~~
 `)
I added the .flat() function to the grouping. Not sure if that is the correct way to do it. I’ve read that FLATTEN does not exist in dataviewjs the same as it does in the regular query language, and from top web results it seems that .flat() should do it, but I must not be using the right strategy.
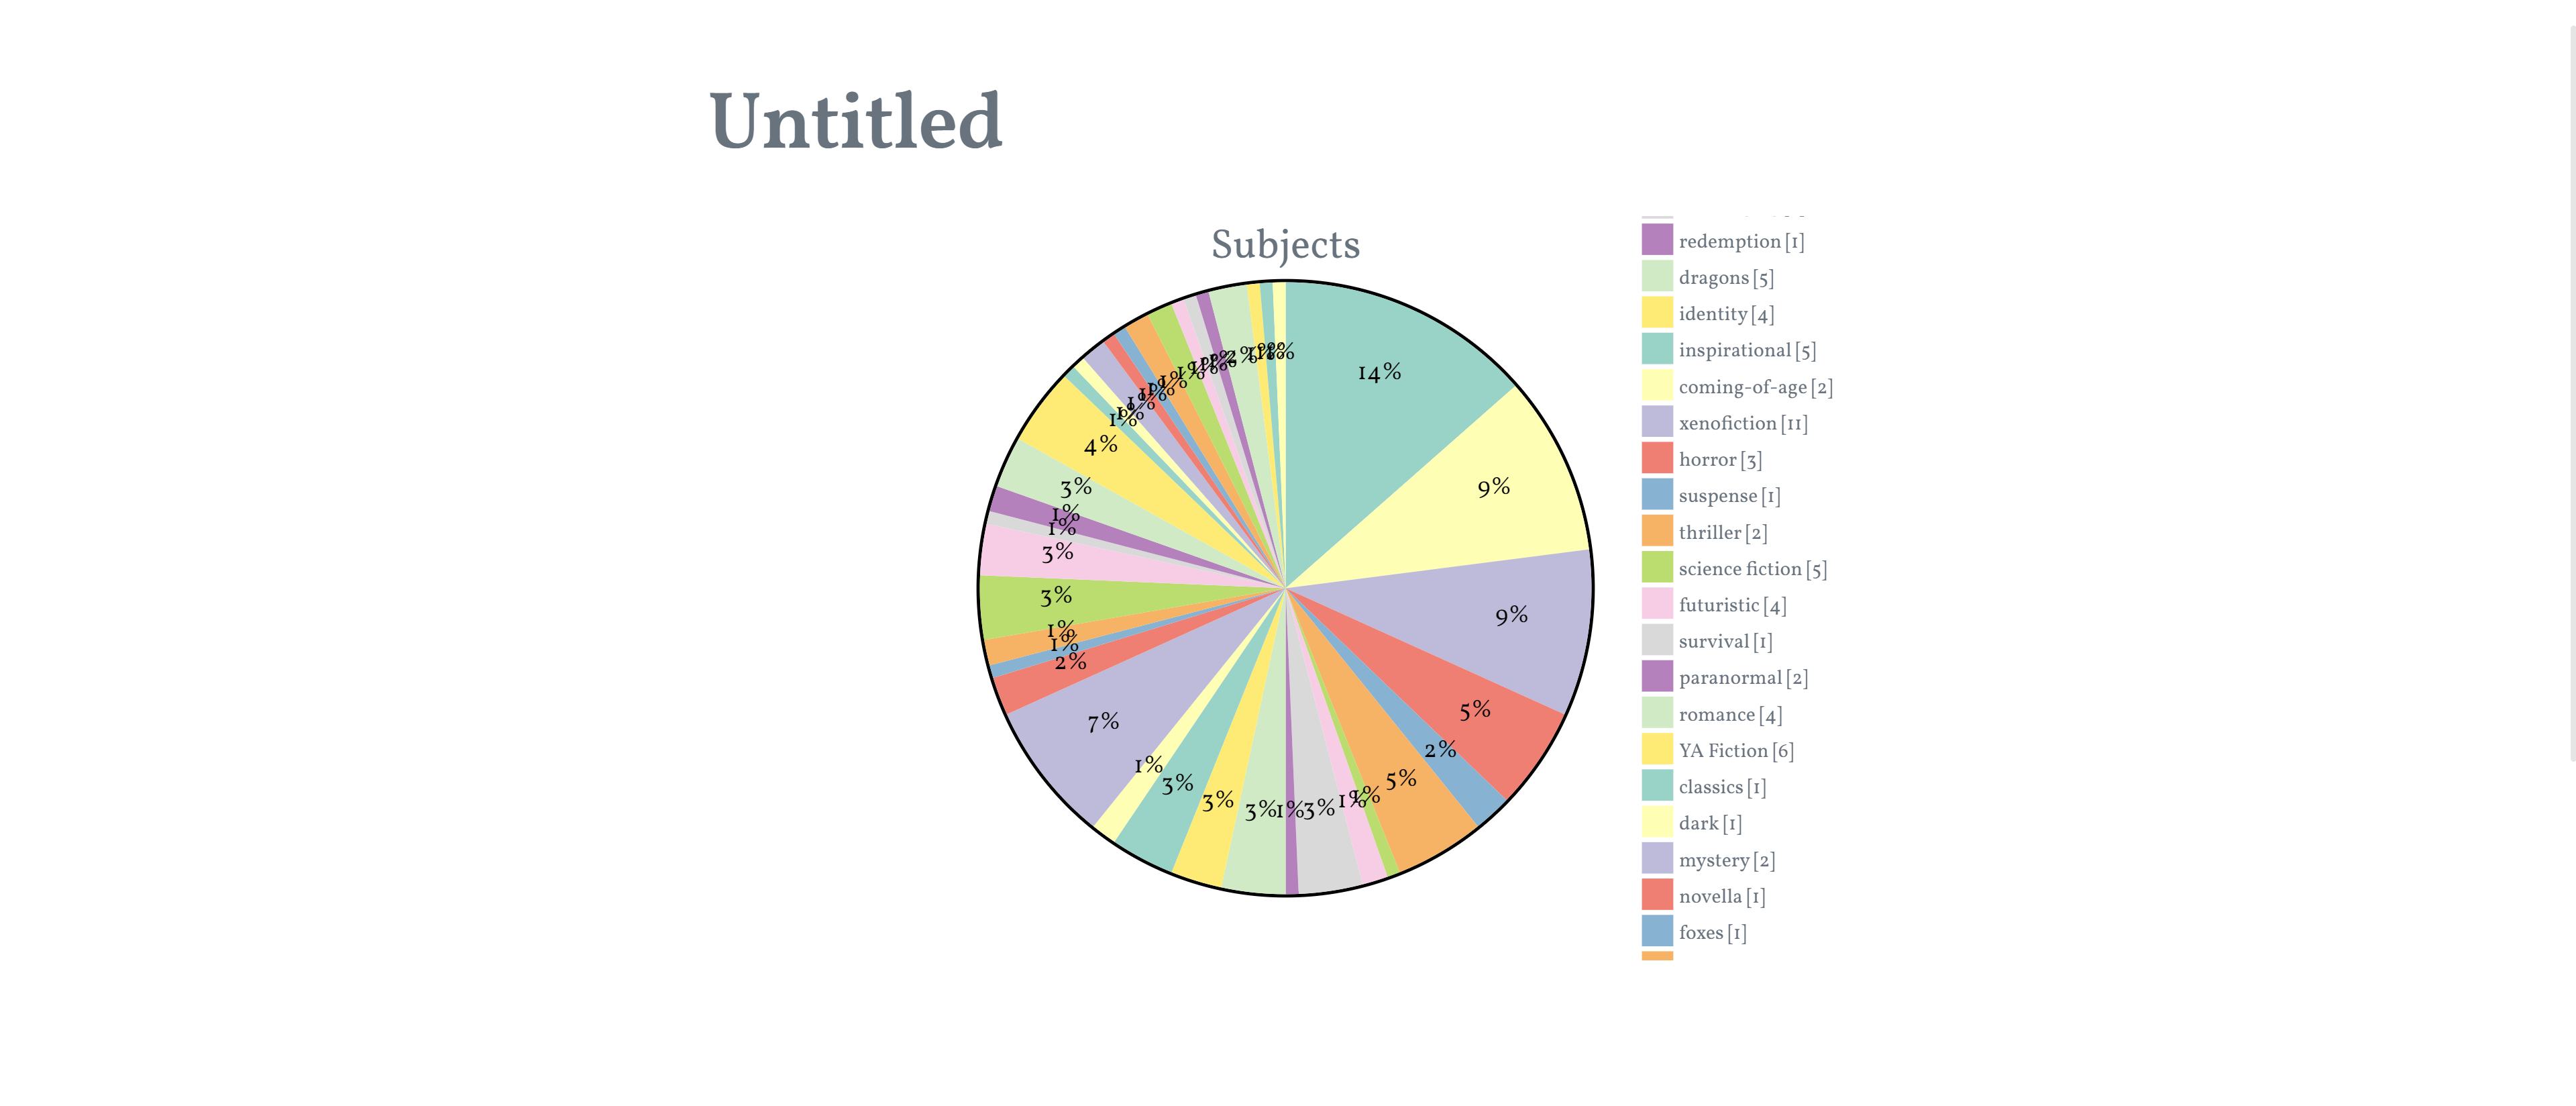
I’d rather loop on the original set of notes, and make a temporary table to collect the number of the various subjects. Your code should then look something like the following:
```dataviewjs

let subjects = {} // Will hold the count of each subject

let pages = dv.pages()
  // only get books I have read already
  .where(p => p.status == "read" || p.status == "#read")
  // Loop and count each of the subjects
  .subject.forEach(s => {
    if ( s in subjects ) {
      subjects[s] = subjects[s] + 1
    } else {
      subjects[s] = 1
    }
  })

let graphText = ""; // declare variable for use in the pie chart graph later

// Now subjects holds each subject with the count of notes it appearead in,
// so lets loop on that and produce the data for the pie chart
for (const [subject, count] of Object.entries(subjects)) {
   graphText += `  "${subject}" : ${count}\n`;
}

// mermaid pie chart graph output
dv.paragraph(`
~~~mermaid
pie title Subjects
${graphText}
~~~
`)
```