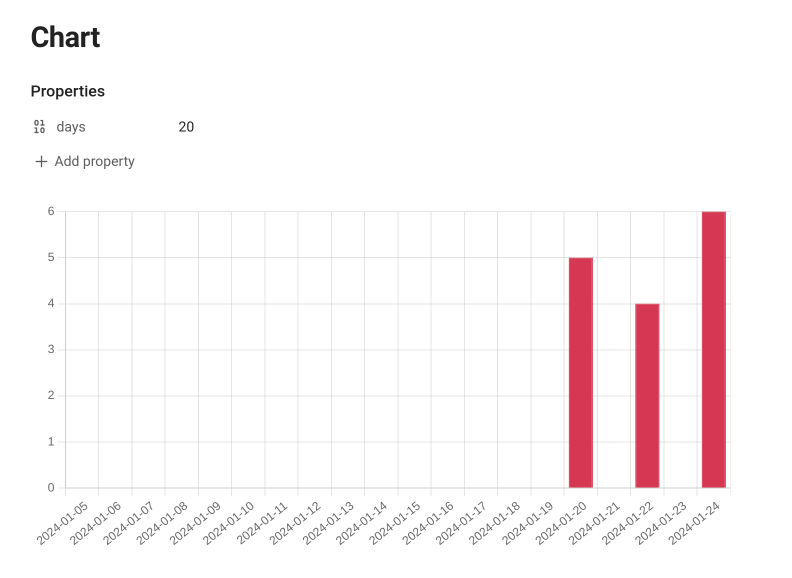
I am trying to setup a graph using Obsidian Charts that shows the number of notes created for each day in the past 60 days (days = 60). Somehow the list returned by the countNotes-function did not count any notes.
My suspicion is that it has something to do with the line:
‘let notes = dv.pages(’‘).file.where(f => f.cday === dateToCheck);’
How do I get this to work?
const dateformat = "YYYY-MM-DD";
const days = parseInt(dv.current().days);
const projectFolder = '';
const graphColor = dv.current().lineColor1 || '#de454e';
const charts = [];

if (!(days)) {
    dv.el('strong', 'Note Graphs: to generate graphs, please add days, months, or years (or all three!) in your file properties.');
}


function countNotes(dates) {
    var noteAmounts = [];
    var noteLabels = [];

    for (let i = dates.length - 1; i >= 0; i--) {
        let dateToCheck = dates[i]; // Replace this with the specific date you are looking for


        let notes = dv.pages('').file.where(f => f.cday === dateToCheck);


        noteLabels.push(dates[i]);
        noteAmounts.push(notes);
    }

    return { amounts: noteAmounts, labels: noteLabels };
}

function getDailyNotes(numDays) {
    let dates = createArrayOfDates('days', dateformat, numDays);
    return countNotes(dates);
}

function createArrayOfDates(range, format, num) {
    const start = moment().add(1, range).startOf('day');
    let dates = [...Array(num)];
    console.log(dates);
    return dates.map(() => start.subtract(1, range).format(format).toString());
}


if (days) {
    const dailyNotes = getDailyNotes(days);
    charts.dayChart = {
        type: 'bar',
        data: {
            labels: dailyNotes.labels,
            datasets: [{
                label: 'Daily created notes',
                data: dailyNotes.amounts,
                backgroundColor: [
                    graphColor
                ],
                borderColor: [
                    graphColor
                ],
                borderWidth: 1
            }]
        },
        options: {
            plugins: {
                legend: {
                    display: false
                }
            }
        }
    }
}


if (!window.renderChart) {
    dv.el('strong', 'Note Graphs: Please install and/or enable the Obsidian Charts plugin');
} else if (!input.container) {
    dv.el('strong', 'Note Graphs: Your include has a syntax error. Please see documentation and supply the correct parameters.')
} else {
    if (days) window.renderChart(charts.dayChart, input.container);
    input.container.style.width = "100%";
}