DataviewJS & Charts, how to get a cumulative line chart out of daily outcome values

Things I have tried

I searched for topics that go into the direction of what I am trying to achieve but couldn’t find something that specific.

What I’m trying to do

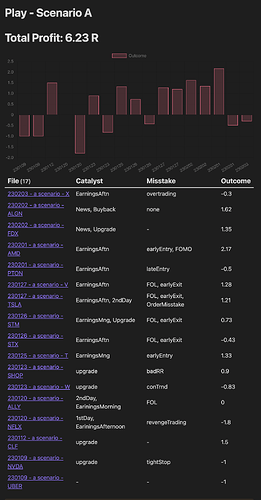
I have daily notes, that all have an outcome value in the frontmatter. Now I want to create a line chart that shows me a cumulative curve of the daily sum of all the values based on the date.

I did find a way to sum up all the values and to display for each day in a graph.

Does anybody have an idea how to achieve that?

Here’s an example of some of my notes arranged in a table. Note the outcome column, that I want to display as a line chart adding up each day…

1 Like

So basically your queries and charts are correct, but you want to group them by day, and sum up the outcome?

Could you show us the queries? And tell us which charts plugin you’re using? (Did you say this in the other thread? )

I am using the Obsidian Charts PlugIn for that.

Here’s the query I am using to generate the bar chart at the top. But I don’t know how to group nor to sum up the groups values…

const pages = dv.pages('"00_Trades"')
.where(b => b.play == "A_Scenario")
.sort(p => p.date, "asc")
const TradeDate = pages.map(p => p.date).values  
const TradeOutcome = pages.map(p => p.outcome).values


const chartData = {  
type: 'bar',  
data: {  
	labels: TradeDate,  
	datasets:[{  
		label: 'Outcome',  
		data: TradeOutcome,  
			backgroundColor: [  
				'rgba(255, 99, 132, 0.2)'  
			],  
			borderColor: [  
				'rgba(255, 99, 132, 1)'  
			],  
			borderWidth: 1,  
		}]  
	}  
}  
  
window.renderChart(chartData, this.container)  
Updated query with groupBy and summation
```dataviewjs
const pages = dv.pages('#f54083')
  .where(p => p.play == "A_Scenario")
  .sort(p => p.date, "asc")
  .groupBy(p => p.date)

// Output the table
console.log(pages)
dv.table(["file", "date", "outcome"],
   pages.values
    .map(p => [p.rows.file.link, p.key, p.rows.outcome]))

const TradeDate = pages.map(p => p.key).values  
const TradeOutcome = pages
  .map(p => p.rows.values.reduce((tmp, curr) => tmp + curr.outcome, 0))
  .values

console.log(TradeDate)
const chartData = {  
type: 'bar',  
data: {  
	labels: TradeDate,  
	datasets:[{  
		label: 'Outcome',  
		data: TradeOutcome,  
			backgroundColor: [  
				'rgba(255, 99, 132, 0.2)'  
			],  
			borderColor: [  
				'rgba(255, 99, 132, 1)'  
			],  
			borderWidth: 1,  
		}]  
	}  
}  
  
window.renderChart(chartData, this.container) /* */
```

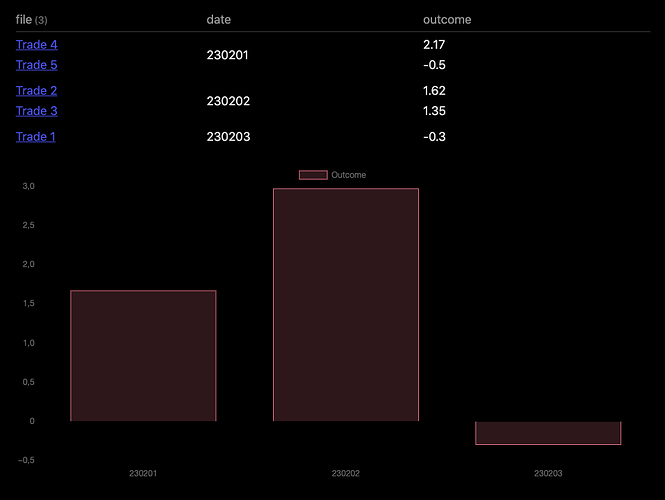
This produces this chart (for the first 5 entries of your list):

The only thing you should need to change is the '#f54083', back into '"00_Trades"', I think. The main changes I’ve done are add the grouping, and a display of the grouped data, and a summation to get the new outcome.

Add grouping and displaying it

The grouping command is just something like .groupBy(p => p.date), where it then groups by that element.

What happens now is that it goes through all elements, and for every unique p.date it groups the rest into rows. In other words, the new page item has a p.key which is set to the (previous) unique value of p.date, and all the values of that group are now “hidden” into arrays in p.rows.

Do please look at the output of console.log(pages) in Developers Tools to get a grasp of how it has changed the data structure.

If you take the plain approach of mapping out the p.rows.file.link and p.rows.outcome you’ll get the output seen above the chart. Notice how there are actually only three rows in this table (as seen by the single p.key value), and that the first and third column are actually lists of values.

Summation of the outcome

So extracting the key value, or date, is just a rename from p.date to p.key, but the summation of the outcome is a little trickier. Here one needs to get the values out of p.rows.outcome and sum them.

This can be done using various tools, I chose to use reduce, which might not be the easiest to read, but we’re talking about this code segment:

const TradeOutcome = pages
  .map(p => p.rows.values.reduce((tmp, curr) => tmp + curr.outcome, 0))
  .values

The map does it usual thing of getting some value for each of the rows of the main query. But what it does to each of those, is to get the value of the (internal) rows variable, and feed that to reduce.

The way the reduce works, is that it takes two parameters, one callback function, and a default value. The callback function is called iteratively on the array we call reduce on.

So with a callback function of (tmp, curr) => tmp + curr.outcome, it’ll add together the temporary value so far, tmp, with the current rows value, curr.outcome. And to get it started, it uses the default value of 0 for the first run into tmp. All-in-all, it keeps reducing the array adding the current outcome into the tmp variable, which starts at zero, until there are no more rows in the array it was fed.


Hopefully that was a good enough explanation for you to understand what’s happening. To get it going in your case, change the pages( ... ) into your original, and after playing around with it a little to see the value, remove the console.log(pages) and dv.table( ... ) statements, and you should have a nice chart of the summed outcome for each date.
I understood what you explained. And works properly.

What we did now is that we sum up the outcome of the day, fabulous. What I also wanted to achieve is to sum up the days themselves. Meaning I have a graph where I can see how the outcome affects the prior days. Adding up …

For instance:

day1.outcome: 1.4
day2.outcome: -0.5
day3.outcome: 2.4

On day2 I would have sum.value of day1 + day2
on day3, a sum.value of day1 + day2 + day3
and so on …

Err… I would have to create another hidden value for each day and reduce it again … I slowly can understand the language but far away from being able to “speak” it.

Can you give me another hint on this?

Is it the same dataset you just want to reduce to accumulate the total sum?

Then you should be able to reduce on the TradeOutcome, so just add a few lines to the bottom of the other script.

const total = TradeOutcome.reduce((tmp, curr) => tmp + curr, 0)
dv.paragraph(`Total outcome this period: ${ Math.round(total * 100, 0)/100 }`)

Thank you … but that’s not exactly what I wanted to achieve. I was looking for an additional graph not showing the sum of each day but the sum of the current day + the sum of the day before etc.

My bad, I totally misread your excellent explanation, and simplified it quite a bit. So here goes another version, try adding the following to the end of the other script, and see if this doesn’t produce the cumulative chart you’re wanting. I leave the styling part up to you, so I’ve just changed the type to 'line'.

/* New data variable and new chart data */
let cumulativeOutcome = [ TradeOutcome[0] ]
for (i = 1; i < TradeOutcome.length; i++) {
  cumulativeOutcome[i] = cumulativeOutcome[i-1] + TradeOutcome[i]
}

const cumulativeChart = {  
type: 'line',  
data: {  
	labels: TradeDate,  
	datasets:[{  
		label: 'Outcome',  
		data: cumulativeOutcome,  
			backgroundColor: [  
				'rgba(99, 255, 132, 0.2)'  
			],  
			borderColor: [  
				'rgba(255, 99, 132, 1)'  
			],  
			borderWidth: 1,  
		}]  
	}  
} 
window.renderChart(cumulativeChart, this.container)

With my (slightly extended data set) I now get these graphs:

1 Like

That’s it!

One last thing, do you think, it’s possible to have a tickbox below the graph that switches between datasets? I’d have to implement an if statement somewhere … right at the top, right?

Last little advice:

let cumulativeOutcome = [ TradeOutcome[0] ]
for ( i = 1; i < TradeOutcome.length; i++) {
  cumulativeOutcome[i] = cumulativeOutcome[i-1] + TradeOutcome[I]
}

needs to be

let cumulativeOutcome = [ TradeOutcome[0] ]
for (let i = 1; i < TradeOutcome.length; i++) {
  cumulativeOutcome[i] = cumulativeOutcome[i-1] + TradeOutcome[I]
}

the missing let is causing issues in other scripts.

2 Likes

This topic was automatically closed 7 days after the last reply. New replies are no longer allowed.