In my Book and Movie database I have charts to show how many books I’ve read and movies I’ve watched. With the great help of people on the Obsidian subreddit I was able to advance that so that it automatically groups it by year and adds a line in the chart for each year.
For the books it looks like this:
The code for this chart is:
``` dataviewjs
	var labels = ["January", "February", "March", "April", "May", "June", "July", "August", "September", "October", "November", "December"];
	var colors = [['#ff6384'],['#36a2eb'],['#ffce56'],['#4bc0c0'],['#9966ff'],['#ff9f40']]
	var datasets = [];

	for(
		let results of dv.pages('"Book Log"')
			.where(p => p.DateFinished) //or p.DateFinished && p.Pages
			.sort(p => p.DateFinished, 'asc')
			.groupBy(p => (dv.date(p.DateFinished).toFormat("MMMM yyyy")))
			.sort(ym => ym.rows.DateFinished.first(), 'asc')
			.groupBy(ym => (dv.date(ym.rows.DateFinished.first()).year))
			.sort(y => y.key, 'asc')
		) {
			let lbl = "Books read in " + results.key;
			let backCol = colors[datasets.length%colors.length];
			let bordCol = colors[datasets.length%colors.length];
			let bWidth = 1;

			let innerArray = [0,0,0,0,0,0,0,0,0,0,0,0];
			results.rows.forEach(m => {
				let numBooks = dv.array(m.rows).length;
				//OR .Pages.array().reduce((s,r) => s + r, 0);
				innerArray[m.rows.DateFinished.first().month-1] = numBooks;
			})

			let da = {label: lbl, data: innerArray, backgroundColor: backCol,
					  borderColor: bordCol, borderWidth: bWidth};

			datasets.push(da)
		}

	const chartData = {
		type: 'line',
		data: {labels: labels, datasets: datasets},
		options: {scales: {yAxis: {suggestedMin: 0, ticks: {stepSize: 1}}}
	}}
	window.renderChart(chartData, this.container);
This is great, however now I’d like to divide this by medium, which I use as a frontmatter variable. E.g. I have “book”, “audiobook”, “podcast”, “movie”, and “tv” (the latter two are in a different chart).
I’ve successfully divided the movie and tv chart by adding tags, and then changing the code to let results of dv.pages('#TV'), instead of `let results of dv.pages(‘“Movie Log”’). I can then add that whole code block again to render two lines in the same chart, one for #TV, one for #Movie:
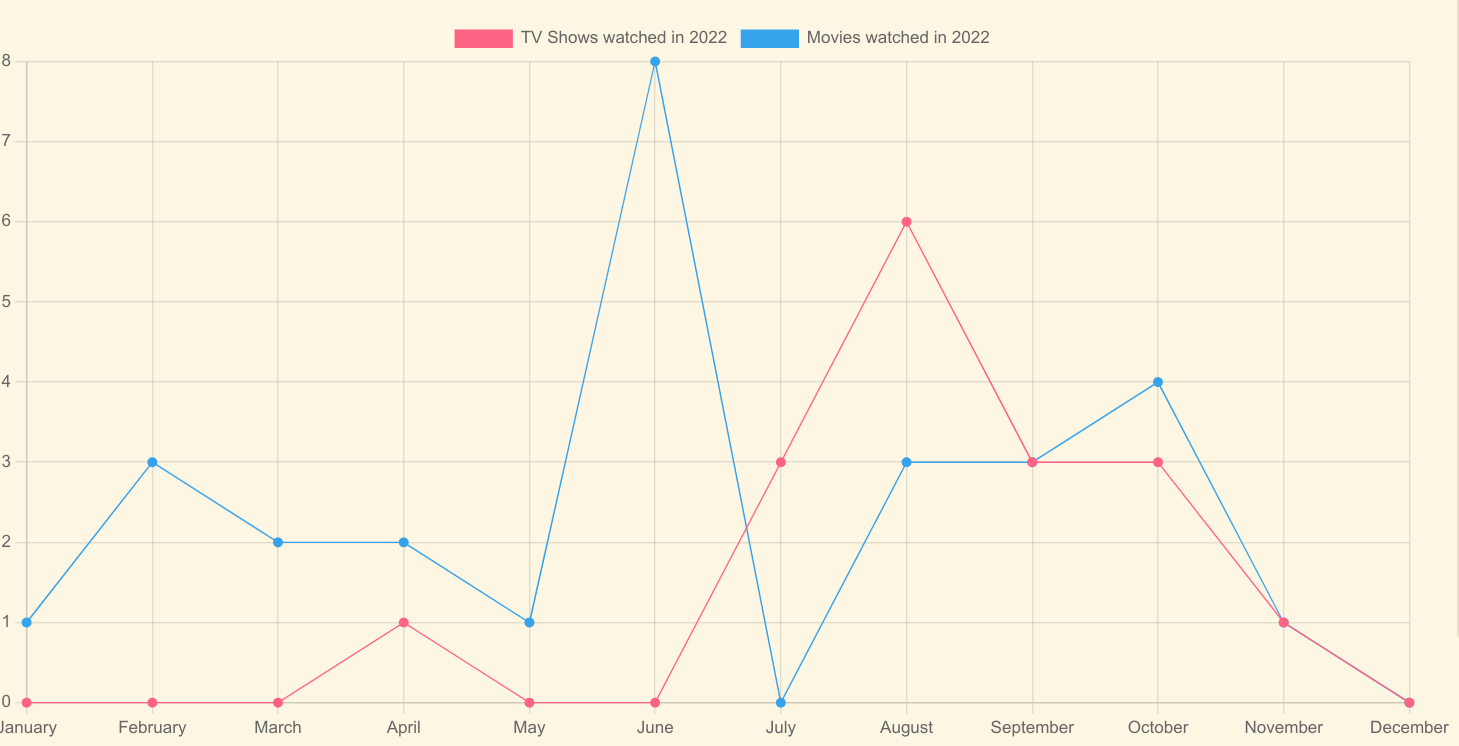
The problem with that solution is that if I add in a test note for a movie that I would have watched last year, these are not considered somehow. So that this solution appears only to work for the current year, I think. And also I feel like it’s redundant to have to add a tag to the note, that it’s e.g. a #TV show, when I’m also using Medium: TV in the same frontmatter.
If I leave it so it gets the data from the folder, the values successfully get added up and it looks like this:
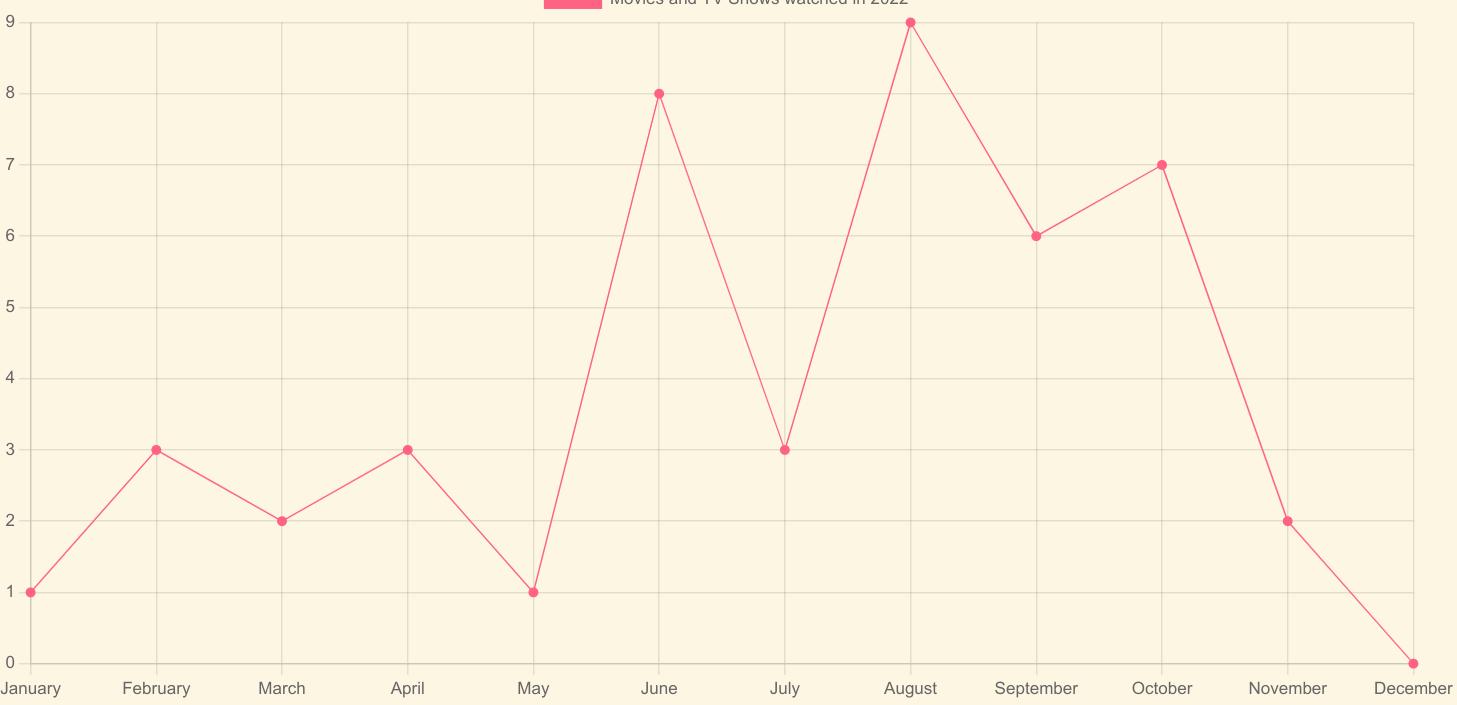
So: Is it possible to keep the divided years, yet still further divide by medium?
An example of my frontmatter:
---
Author: Stephen King
Title: The Shining
Year: 1977
Medium: Book
Pages: 312
Rating:
DateStarted: 2022-07-24
DateFinished:
Cover: https://books.google.com/books/content?id=8VnJLu3AvvQC&printsec=frontcover&img=1&zoom=1&edge=curl&source=gbs_api
Tags:
Country: US
---
Thanks ![]()
Oh, and PS, I guess: Would it be possible to render a “total books read in year X”, e.g. next to the line for that year? I can’t figure out how to go about this.
Thanks!