Hi everyone, a few hours ago I made this post where I got exactly the answer I was looking for. However, I now have another similar question: how can I now take the value in Percentage and have it visualized in a pie chart with the Charts plugin?
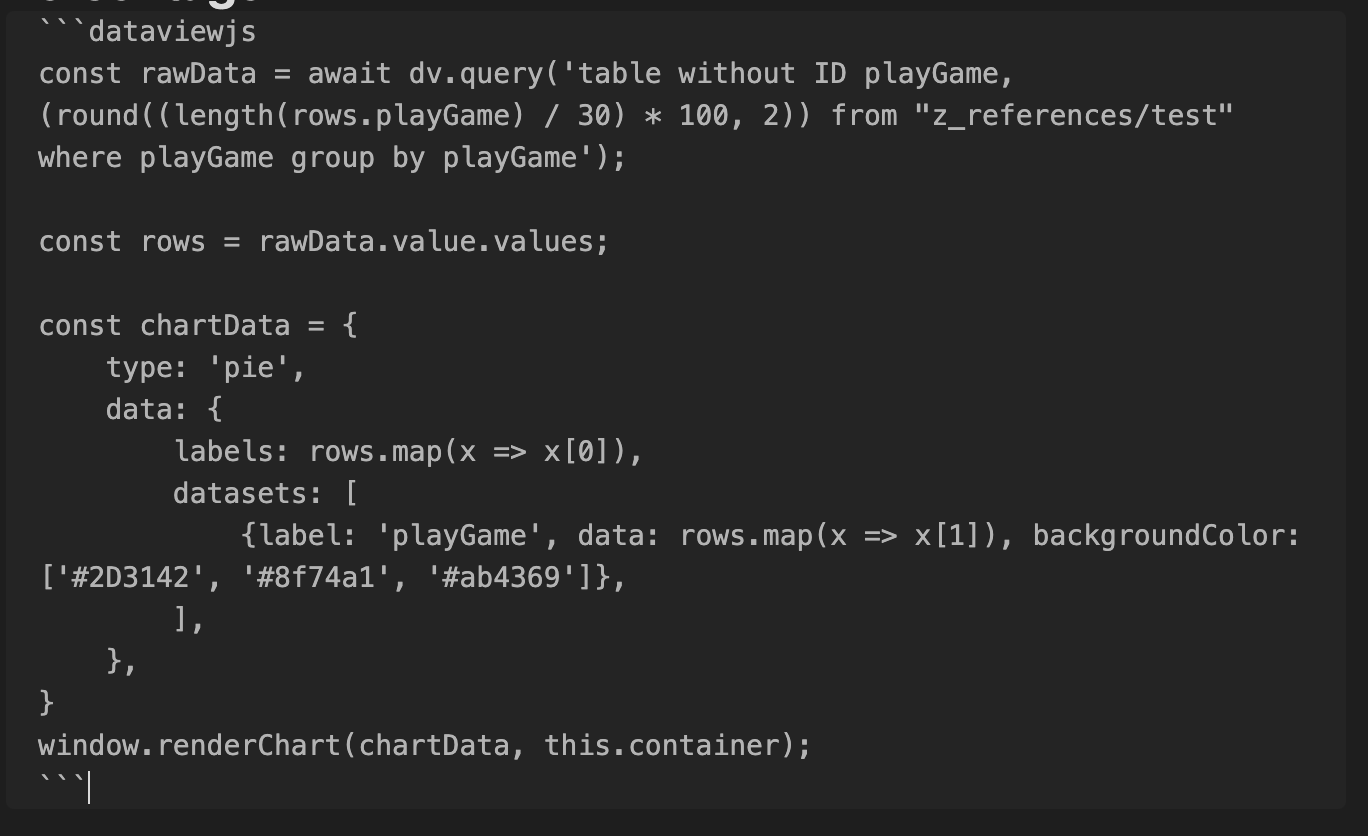
I’ve used the following code to make simple charts where the most complicated thing was just some arithmetic.
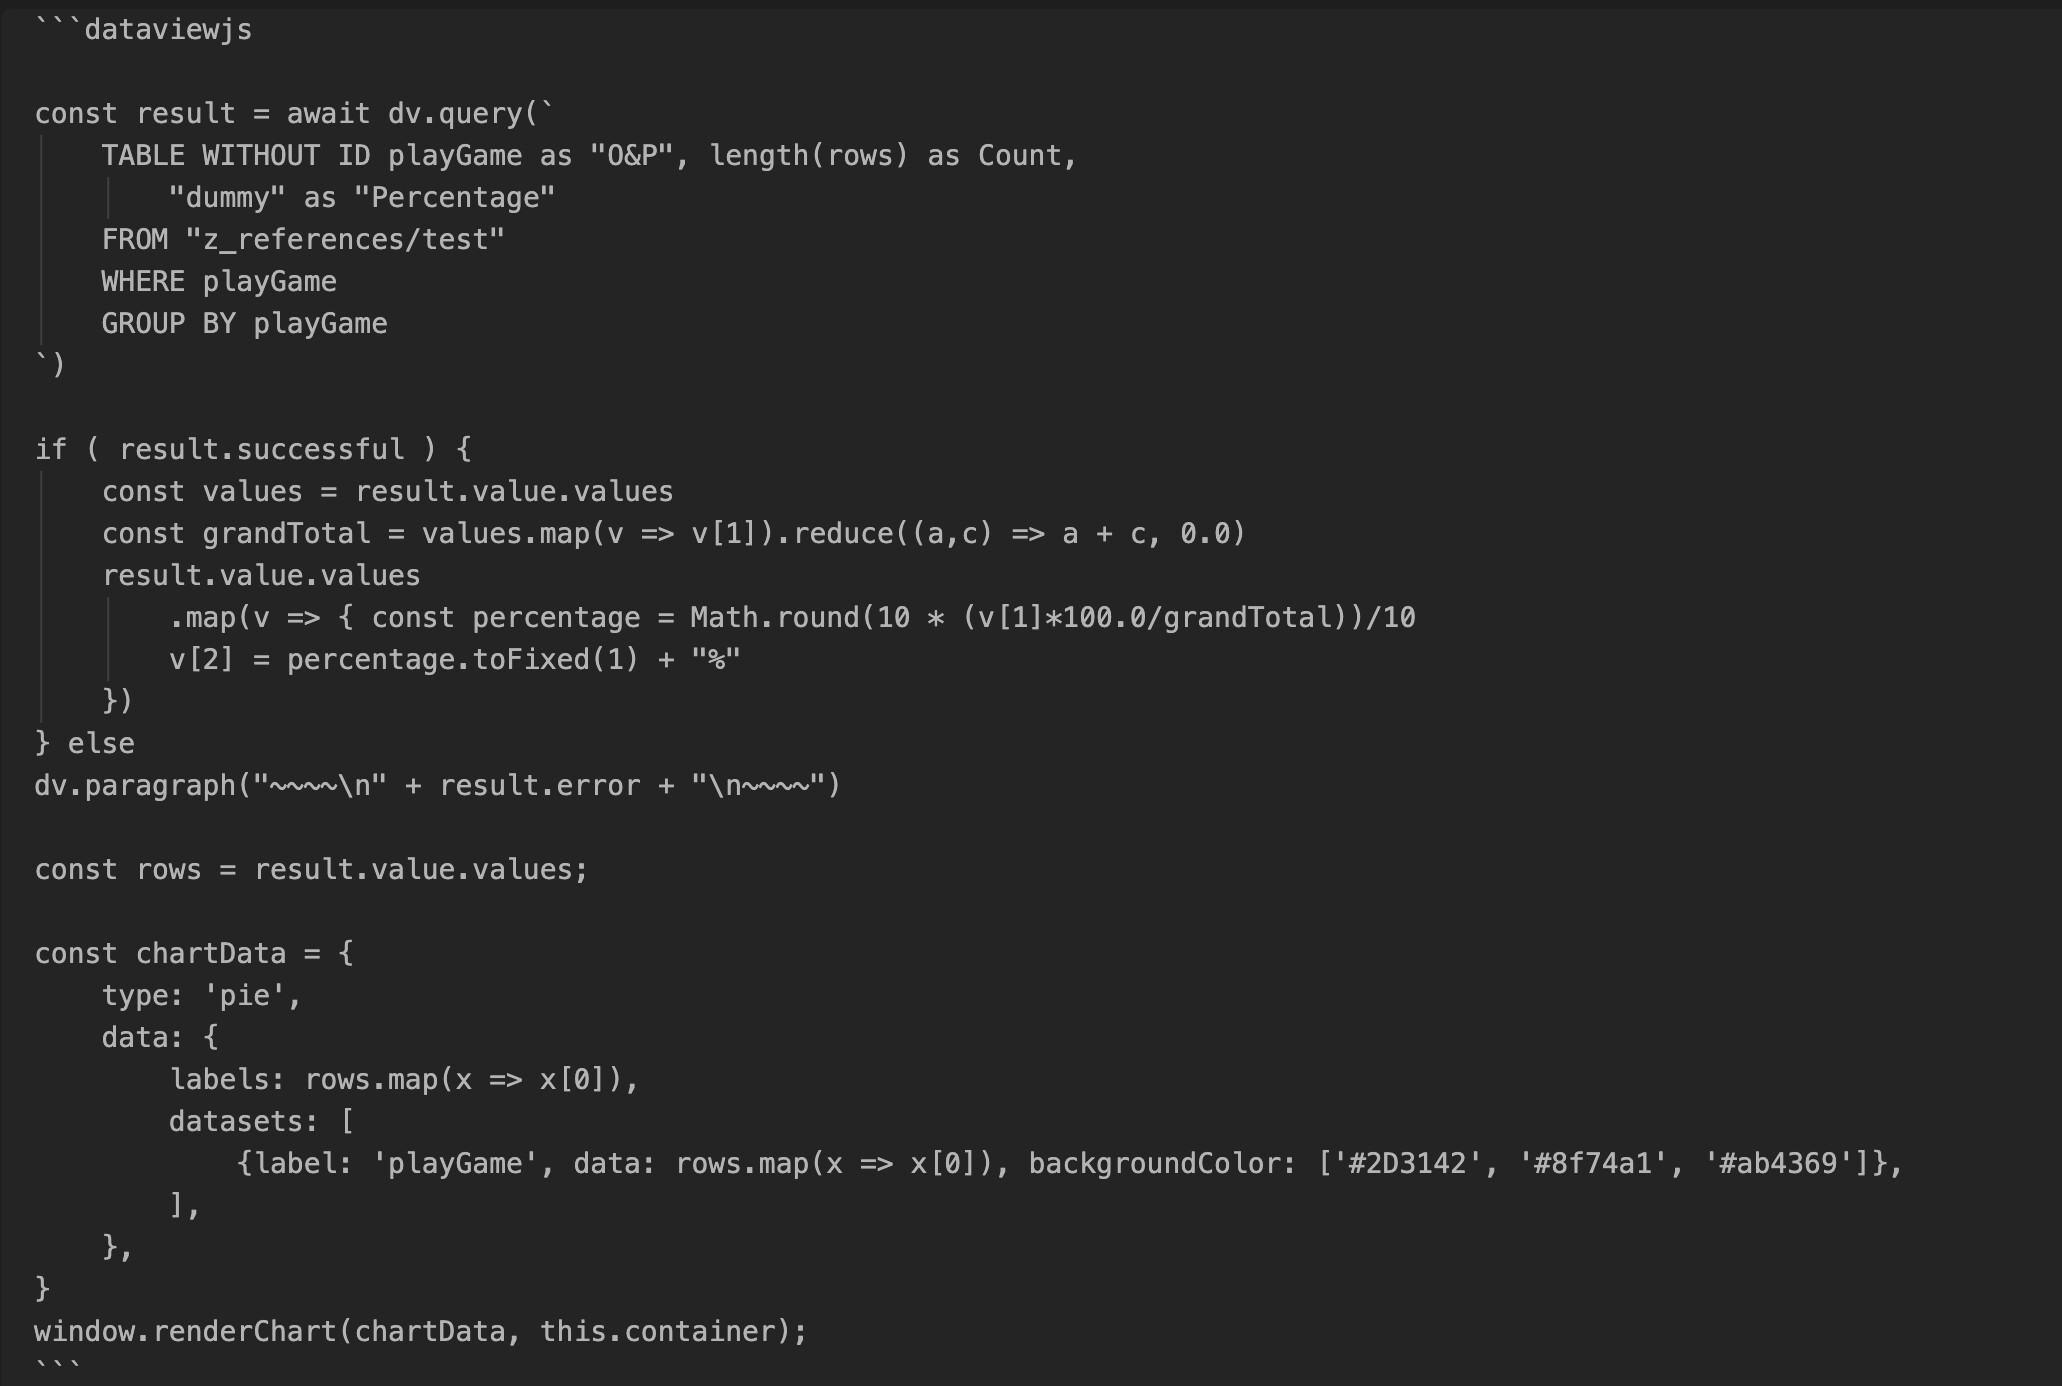
I did try cannibalizing parts of the code provided by holroy in the previous post into the Charts code as seen here, but ultimately it gave me a blank square, which is probably no surprise to anyone who can actually code.
Please copy the code into your post, and not images of code. It makes it a whole lot easier to try your queries.
Bonus tip: How to present code properly in a forum post
If you want to showcase either markdown, or code blocks, or dataview queries properly in a forum post, be sure to add one line before and one life after what you want to present with four backticks, ````. This will ensure that any other backticks (like for code blocks or queries) is properly shown.
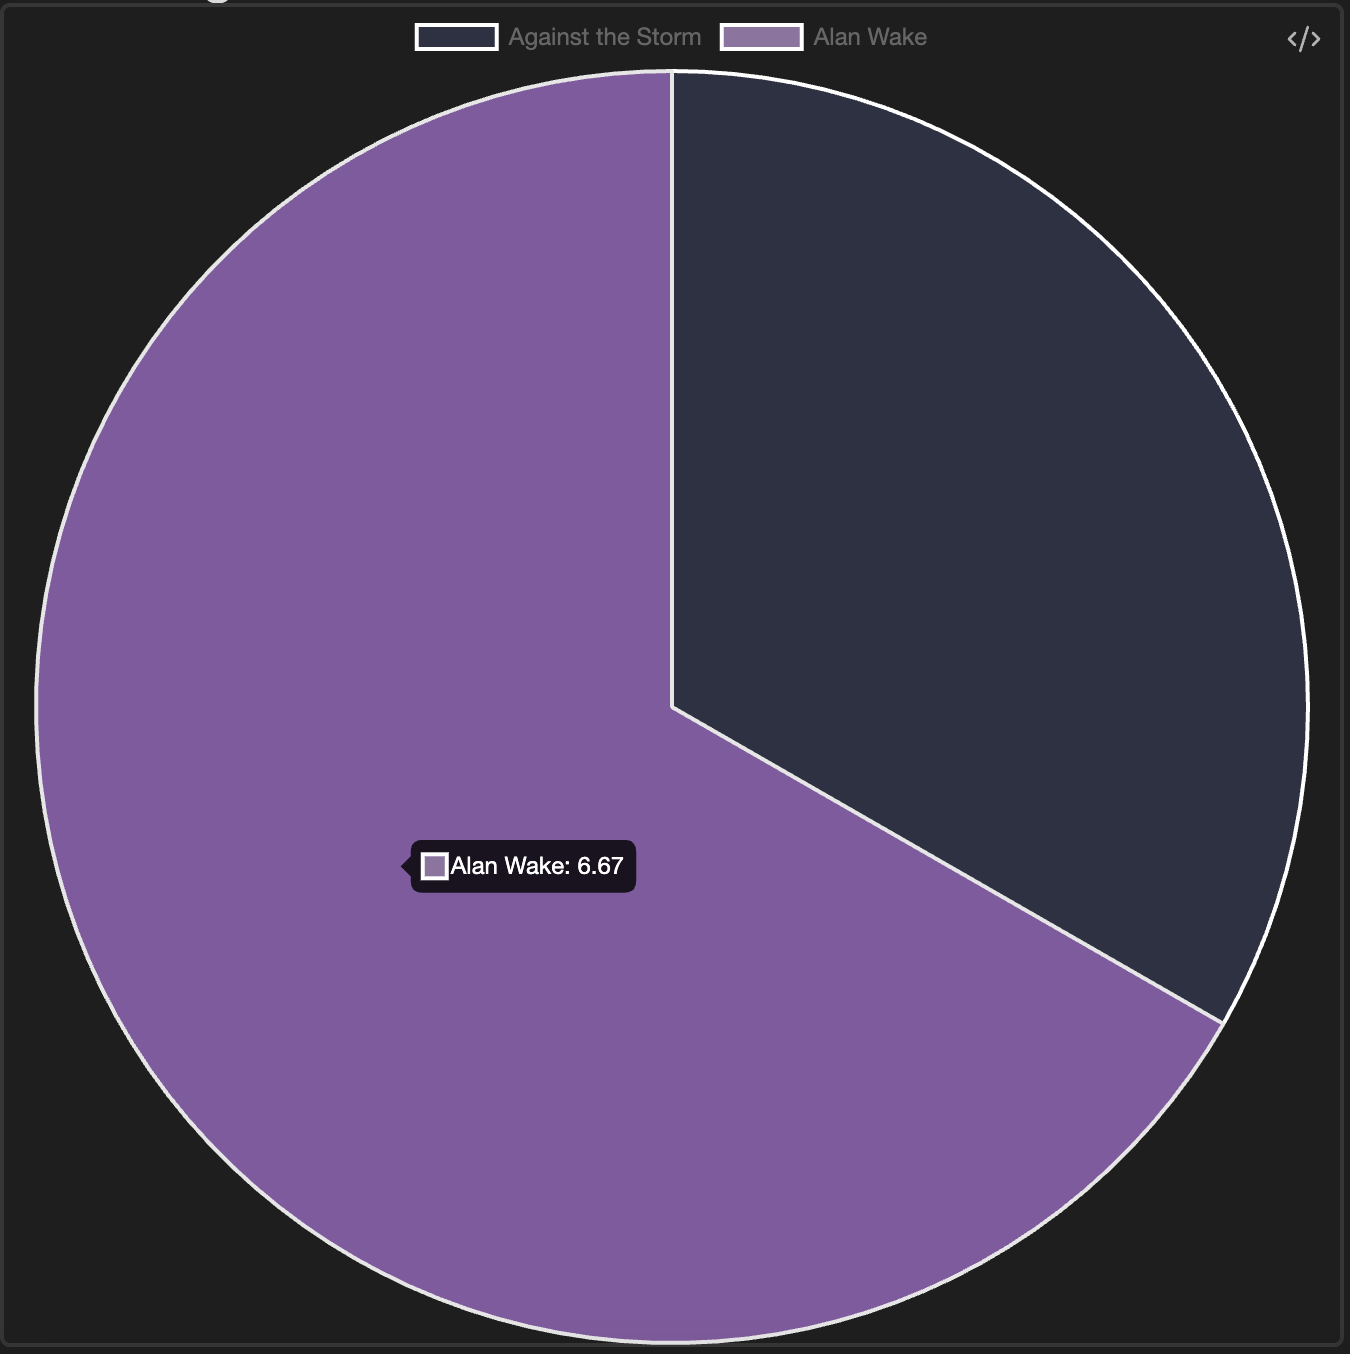
It seems like you’re quite close, and just made a typo in the datasets map, where you need to do x[1] to get to the count.