Hey guys, I’ve got a bit of a head scratcher that may or may not involve dataviewjs. To start: I have a list property called playGame . Inside it, I just put the name of any games I played that day. What I’m trying to do is make a table that A) lists all the games I played in a given month, B) list how many times I played that specific game, and C) the percentage of how much I played that game compared to other games (ex: game1/gameMonthTotal)
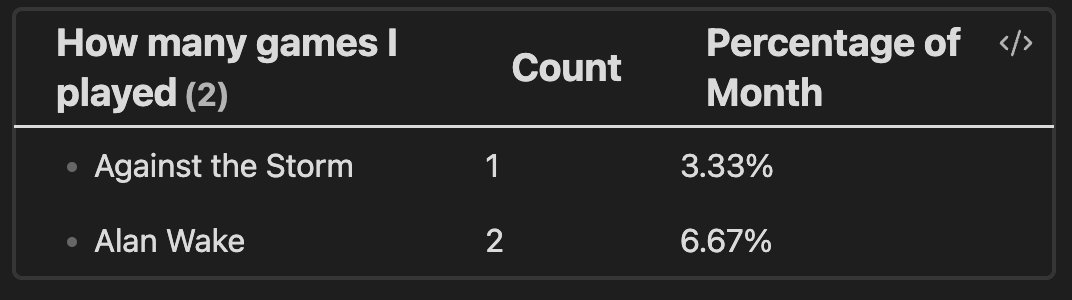
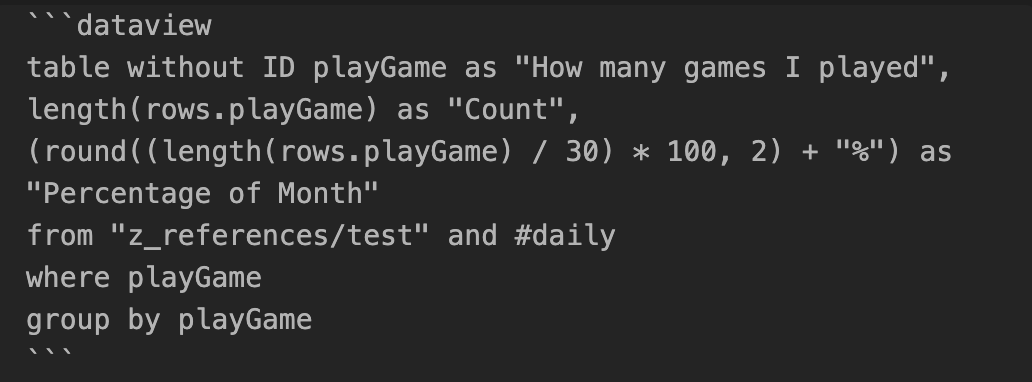
Here is the table I’ve managed to make so far along with the code I used:
As you can see, I’ve figured out everything save for that percentage part, which currently just compares it to the entire month. What I want is for Dataview to tally up “Count”, then find a percentage for each individual game. So for example, with Count Total = 3, Against the Storm would then come out to 33.33% instead of 3.33%, Alan Wake would be 66.66% instead of 6.66%, and so on and so forth. 1. I’ve tried a couple of permutations to get what I was looking for, but I just couldn’t get it and I would appreciate any help
Just some hours ago I wrote this answer depicting various ways to do varying sums over a query. We can use the same kind of summing in your case.
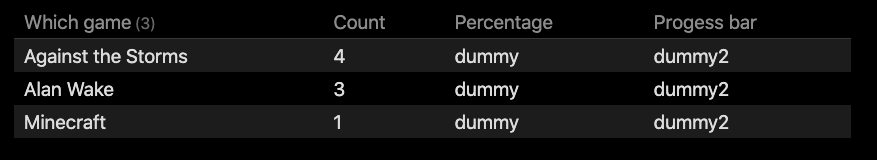
The only difference is that you want to add the percentage depending on the sum in every line of your table. So to prepare the query for that we add a dummy column (or two), so our base query could then look like (somewhat simplified related to yours, but hopefully you’ll see the similarities):
```dataview
TABLE WITHOUT ID playgame as "Which game", length(rows) as Count, "dummy" as "Percentage", "dummy2" as "Progess bar"
FROM "ForumStuff/f71/f71397"
WHERE playgame
GROUP BY playgame
```
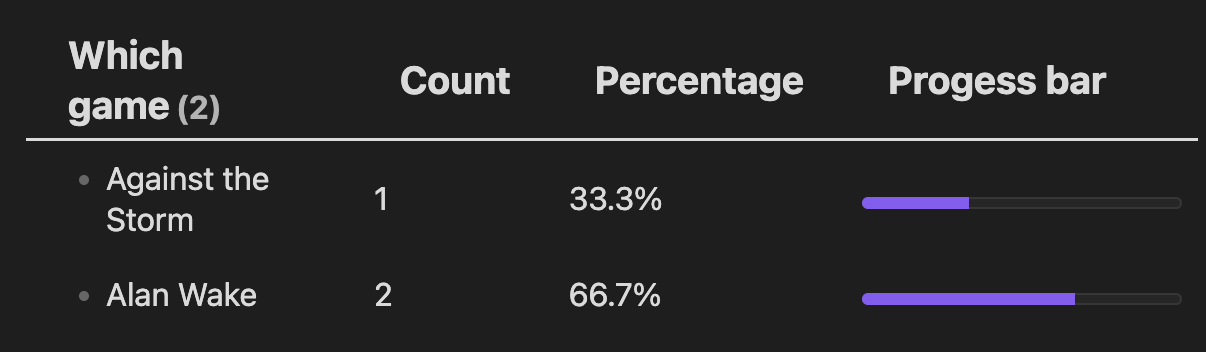
When calculating the percentage I use a little trickery to round it to one decimal by rounding the value multiplied by 10, and then dividing it again. Furthermore I use toFixed(1) to always display the percentage with one decimal.
See the other thread for more on how the grand total was calculated, and in addition to that we just use a map() in addition on every row to modify the content of the third (v[2]) and fourth ([3]) column.
You’re the absolute man, thank you so much. I figured the answer was in JS, but since I have a very limited coding background, I had no idea how to go about it. Thank you again so much.