I’m sorry to say that most likely you’re not able to do that within a pure dataview query. And the image you’re showing, I’m quite certain is actually showing the result of multiple queries. One for each month.
The easiest way I see for doing something similar, would be to use dataviewjs, collate all the entries, and then loop through and populate all the various types it runs across, and then present one table for each of the types. This shouldn’t be too hard to do, but it does require a little bit of coding.
Slight review of your original query
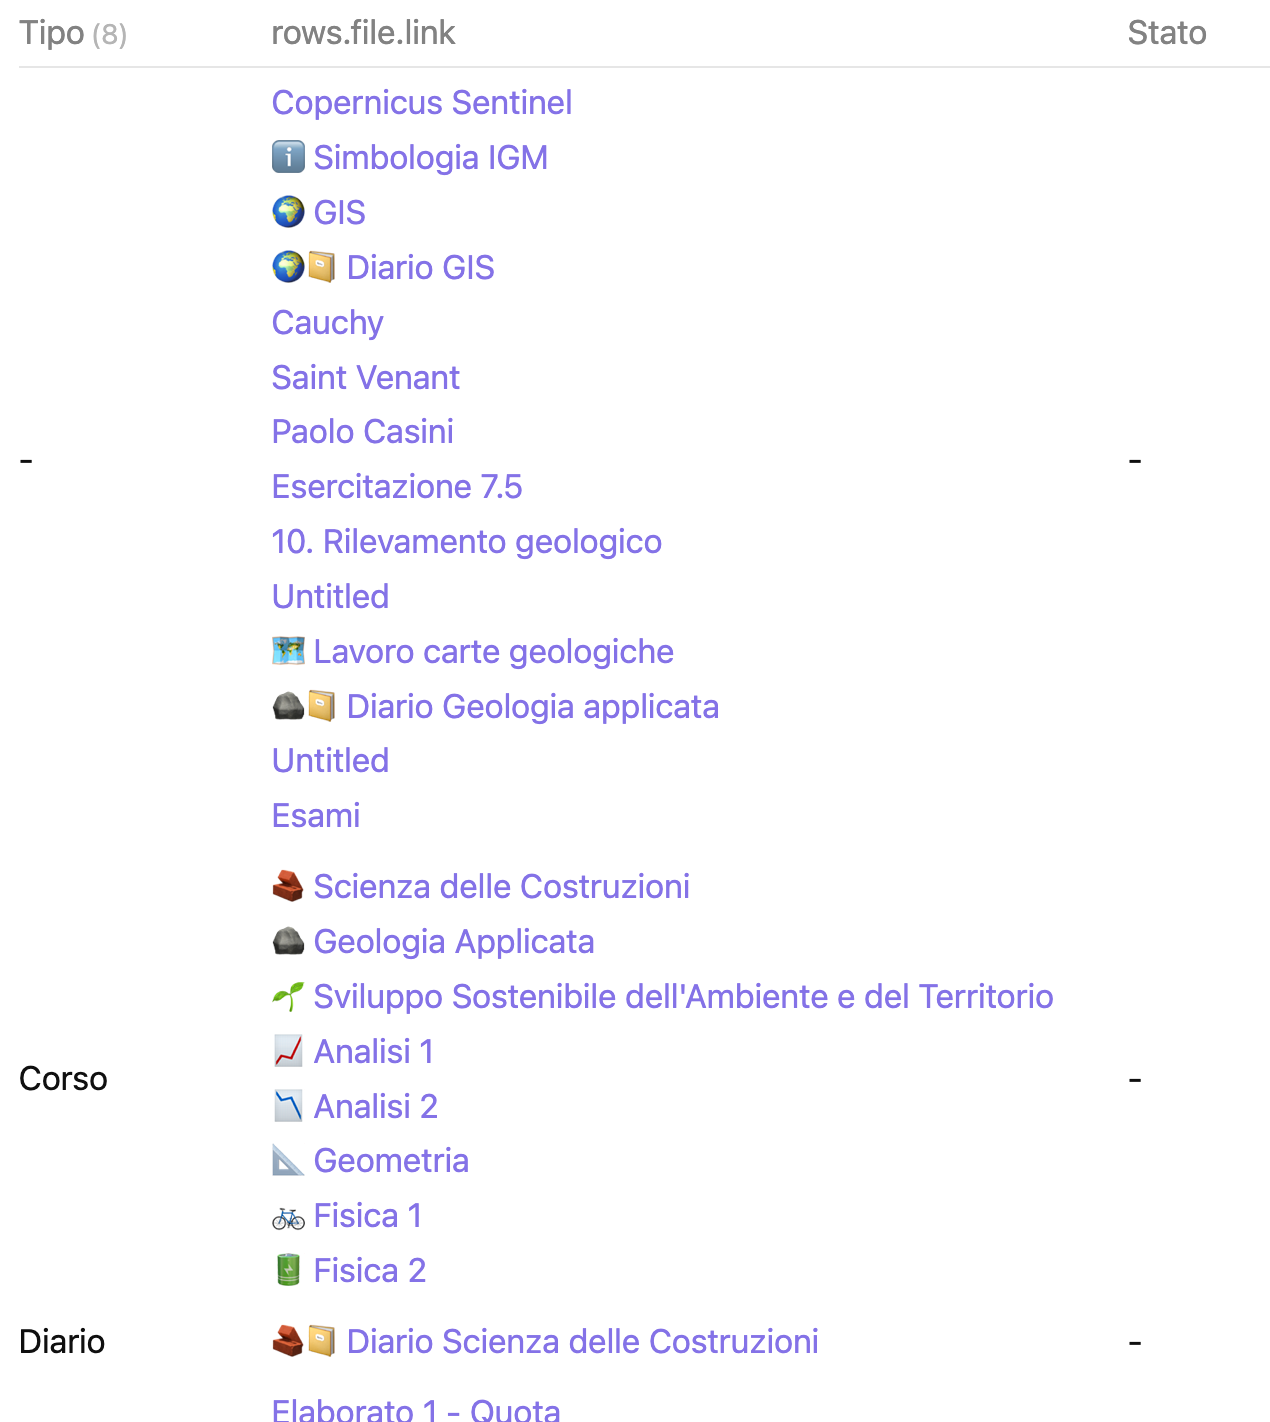
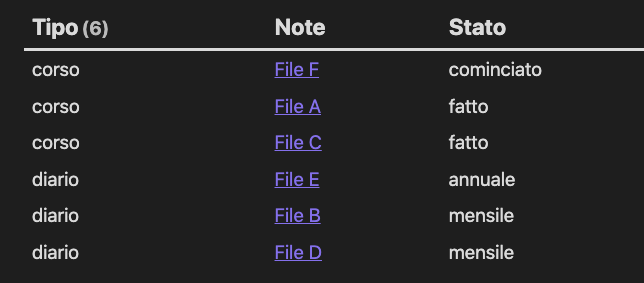
Before presenting a more general solution to building with headers, I want to revisit your query. Currently due to the GROUP BY every file is grouped together, and presented as a list. For better handling later on, we need each file to be on its own row. This can be achieved by using FLATTEN, and some changes to the field references. This gives a query like:
```dataview
TABLE
  R.file.link as Note, R.stato as Stato
FROM
  "Università"
GROUP BY
  Tipo
FLATTEN rows as R
SORT Tipo, R.stato
```
This produce something similar to:
Of course with more sensible values instead of my test data.
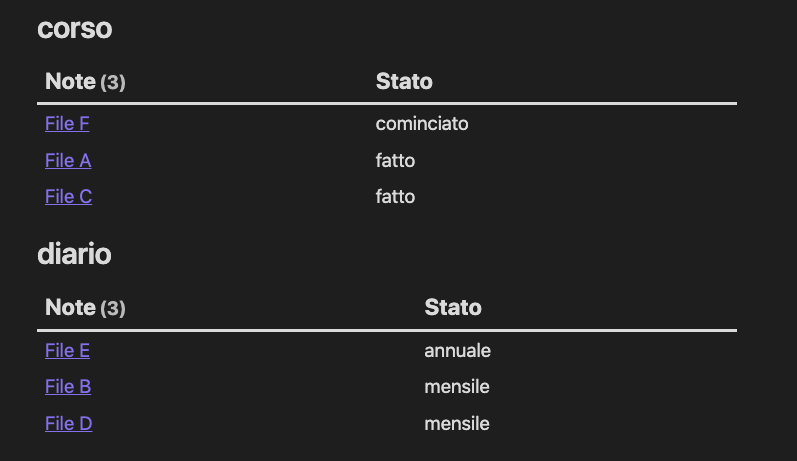
DataviewJS generating headers
Generic script generating headers from first column
```dataviewjs

const notes = await dv.query (`
TABLE
  R.file.link as Note, R.stato as Stato
FROM
  "Università"
GROUP BY
  Tipo
FLATTEN rows as R
SORT Tipo, R.stato
`)

console.log(notes)

if (!notes.successful) {
  dv.paragraph(`~~~~\n${ notes.error }\n~~~~\n`)
  return
}

let typeDict = {}
for (let note of notes.value.values) {
  if ( !typeDict.hasOwnProperty(note[0]) )
    typeDict[note[0]] = []

  typeDict[note[0]].push([...note.slice(1)])
}

for (let key of Object.keys(typeDict)) {
  dv.header(2, key)
  dv.table([...notes.value.headers.slice(1)],
    typeDict[key])
}
```
In the script above, if you change the query in the lines between const notes = await dv.query(` and `), it should generate one table for each of the values in the first column. If you change the query to have more columns, that should also be OK.
This way, if you feel like changing the query you shouldn’t need to know that much javascript, as long as these criteria are met:
- Just change the stuff in the
dv.query(), as indicated above, so that it produces a table like shown above
- The value in the first column will be used as header for each of the tables
- The headers for the rest of the columns are used as headers in the specific tables
This will produce output, based on the above output, like: