The trick to doing this is to sort the overall list before grouping, and then picking out just one of the rows for display. Note that you can still access the overall grouped result from the rows to do other stuff. This allows for both displaying the latest evaluation like you’re asking for, but you could also check for sums, averages, and so on on the rest of the data set.
Here are two queries to showcase this idea:
## All the relevant evaluations (sorted by date)

```dataview
TABLE NoteOrga, NoteProcessus, NoteSolutions, NoteGlobale, DateÉvaluation
FROM "Évaluations"
WHERE TypeÉvaluation = "Finale"
SORT DateÉvaluation
```

## Only the last evaluations

```dataview
TABLE length(rows) as TotalCount, lastEval.NoteOrga, lastEval.NoteProcessus, lastEval.NoteSolutions, lastEval.NoteGlobale, lastEval.DateÉvaluation
FROM "Évaluations"
WHERE TypeÉvaluation = "Finale"
SORT DateÉvaluation
GROUP BY CapacitéÉvaluée
FLATTEN slice(rows, -1) as lastEval
```
On my test setup this displays as:
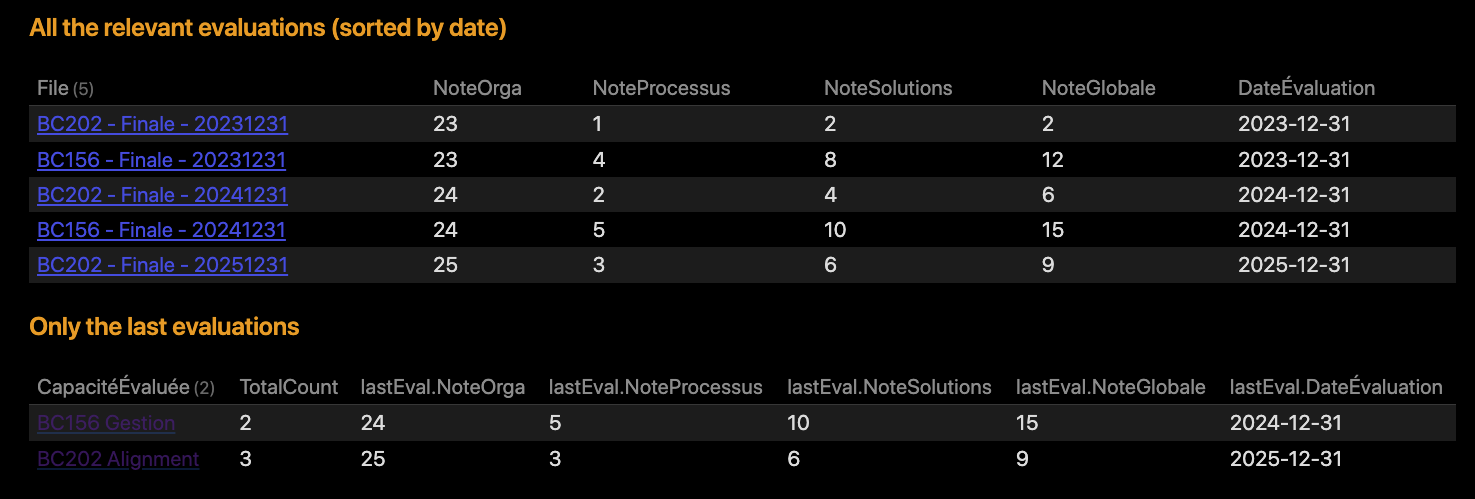
Notice that I’ve added the total number of evaluation available in the second column, just as a proof of concept.
The main documentation site for Dataview is here: Functions - Dataview
Where I’ve focused in on the numeric operations which are what we’re using here. The site has loads of documentation, although there are not a lot of examples on how to use it. But it’s a starting point, and can give you ideas which you can try out, and come back here (or to the Discord) and ask questions to further help your understanding.