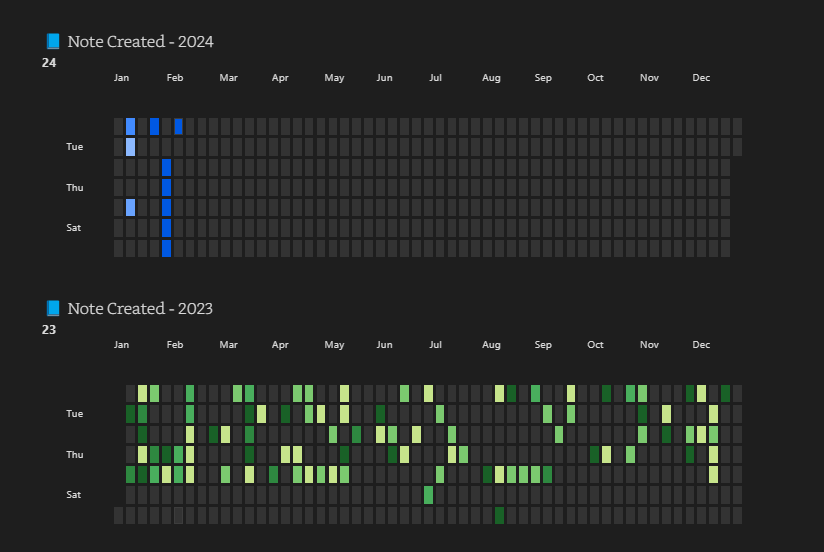
A very simple code block that goes through the entire vault, and plots the notes on heatmap based on the dates that my notes were created. Unfortunately Dataview does return word count, thus using file size for the heat intensity.
You’ll need Dataview and Heatmap Calender to use this.
Note that I have a property called “Created at” for all my notes. If you use something else, remember to update accordingly. Alternatively, try this thing to update your notes.
Finally, the code:
```dataviewjs
dv.span("📘 Note Created - 2023")
const calendarData = {
    year: 2023,  // (optional) defaults to current year
    colors: {    // (optional) defaults to green
        blue:        ["#8cb9ff", "#69a3ff", "#428bff", "#1872ff", "#0058e2"], // first entry is considered default if supplied
        green:       ["#c6e48b", "#7bc96f", "#49af5d", "#2e8840", "#196127"],
        red:         ["#ff9e82", "#ff7b55", "#ff4d1a", "#e73400", "#bd2a00"],
        orange:      ["#ffa244", "#fd7f00", "#dd6f00", "#bf6000", "#9b4e00"],
        pink:        ["#ff96cb", "#ff70b8", "#ff3a9d", "#ee0077", "#c30062"],
        orangeToRed: ["#ffdf04", "#ffbe04", "#ff9a03", "#ff6d02", "#ff2c01"]
    },
    showCurrentDayBorder: true, // (optional) defaults to true
    defaultEntryIntensity: 4,   // (optional) defaults to 4
    intensityScaleStart: 10,    // (optional) defaults to lowest value passed to entries.intensity
    intensityScaleEnd: 2500,     // (optional) defaults to highest value passed to entries.intensity
    entries: [],                // (required) populated in the DataviewJS loop below
}

var daysize = {}

//DataviewJS loop
for (let page of dv.pages()) {
    // dv.span("<br>" + page.file.size) // uncomment for troubleshooting
    var currentsize = page.file.size
    if (page.file.frontmatter["Created at"].split('T')[0] in daysize)
	    daysize[page.file.frontmatter["Created at"].split('T')[0]] += page.file.size
	else
		daysize[page.file.frontmatter["Created at"].split('T')[0]] = page.file.size

    calendarData.entries.push({
        date: page.file.frontmatter["Created at"].split('T')[0],     // (required) Format YYYY-MM-DD
        intensity: daysize[page.file.frontmatter["Created at"].split('T')[0]], // (required) the data you want to track, will map color intensities automatically
        // content: "🏋️",           // (optional) Add text to the date cell
        color: "blue",          // (optional) Reference from *calendarData.colors*. If no color is supplied; colors[0] is used
    })
}

renderHeatmapCalendar(this.container, calendarData)
```