CSS to change the background colour of XY chart from mermaid.js

What I’m trying to do

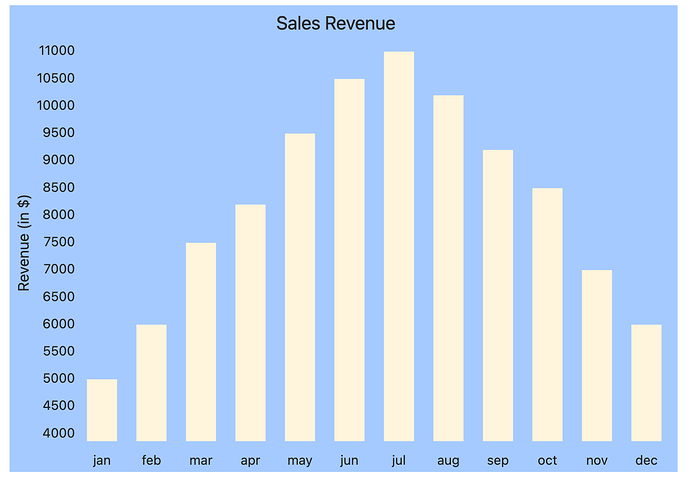
Change the back ground colour of the XY chart to a darker one, so the elements are legible

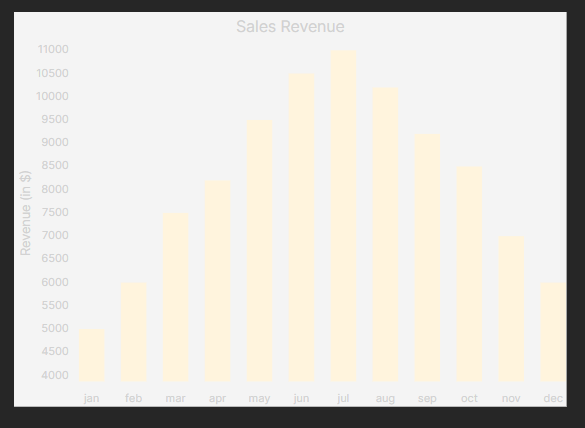
Current appearance

Note that this appearance doesn’t change with the light mode or default theme.
image

Code

This is copied from mermaid.js documentation

xychart-beta
    title "Sales Revenue"
    x-axis [jan, feb, mar, apr, may, jun, jul, aug, sep, oct, nov, dec]
    y-axis "Revenue (in $)" 4000 --> 11000
    bar [5000, 6000, 7500, 8200, 9500, 10500, 11000, 10200, 9200, 8500, 7000, 6000]
    line [5000, 6000, 7500, 8200, 9500, 10500, 11000, 10200, 9200, 8500, 7000, 6000]

Things I have tried

Searching the forum I found somethings for changing the stroke colour here, but I couldn’t modify it to change the background colour.
1 Like

have you tried searching the forum with mermaid css?

note that you can also add style to the mermaid graphs as well, so there multiple options
i no longer use mermaid but i remember this from browsing the forum posts…

You can set Chart Theme Variables in Mermaid: https://mermaid.js.org/syntax/xyChart.html#chart-theme-variables

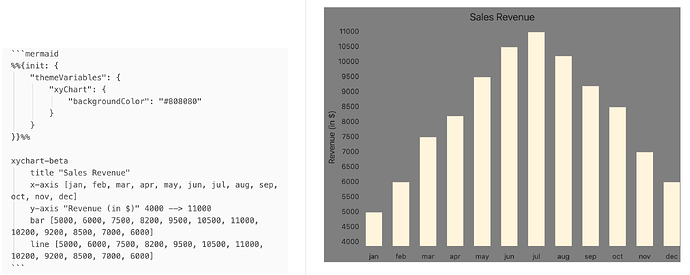
This sets the background color:

      ```mermaid
      %%{init: { "themeVariables": {"xyChart": {"backgroundColor": "#808080"} } }}%%
      
      xychart-beta
          title "Sales Revenue"
          x-axis [jan, feb, mar, apr, may, jun, jul, aug, sep, oct, nov, dec]
          y-axis "Revenue (in $)" 4000 --> 11000
          bar [5000, 6000, 7500, 8200, 9500, 10500, 11000, 10200, 9200, 8500, 7000, 6000]
          line [5000, 6000, 7500, 8200, 9500, 10500, 11000, 10200, 9200, 8500, 7000, 6000]
      ```

1 Like

Thank you!
I don’t suppose there’s a way to set global variables in obsidian?

I don’t know. I haven’t found documentation yet, that would explain in more detail how Obsidian and mermaid.js play together.

I’m just trying out stuff, that I find in Mermaid’s documentation. Some works, like background color, most doesn’t.

meaning you don’t want to repeat the same thing all over again?

you need to find a css solution; that’ll make it global

Any idea, where to find CSS selectors that select particular elements of Mermaid charts, without using Obsidian’s developer tools?

And if you are using dev tools, what CSS selectors have you found, that might help in this case?

off the top of my head, no
but there’s the console/dev tools to look for selectors and the forum search – it’s been a year for me and I can’t find relevant snippets now…

it is possible though I remember wrong and you need to add style to actual graphs
then I’d recommend a text expander solution which pre-populates the mermaid fence and the background at a minimum

xyChart actually does have some useful selectors in Obsidian. (Not sure, why I overlooked it the last time I checked.) It is possible to overwrite the background color with this CSS:

.mermaid svg[aria-roledescription="xychart"] g.main rect.background {
  fill: var(--color-blue);
}

Replace --color-blue with any variable, custom or predefined.

EDIT: Playing a bit more with CCS, I’d apply the background color at a higher level. The trick here is to make the graph’s background transparent.

.mermaid svg[aria-roledescription="xychart"] {

  padding-right: 1em;
  background-color: var(--color-blue);
    
  & g.main rect.background {
    opacity: 0;
  }
}

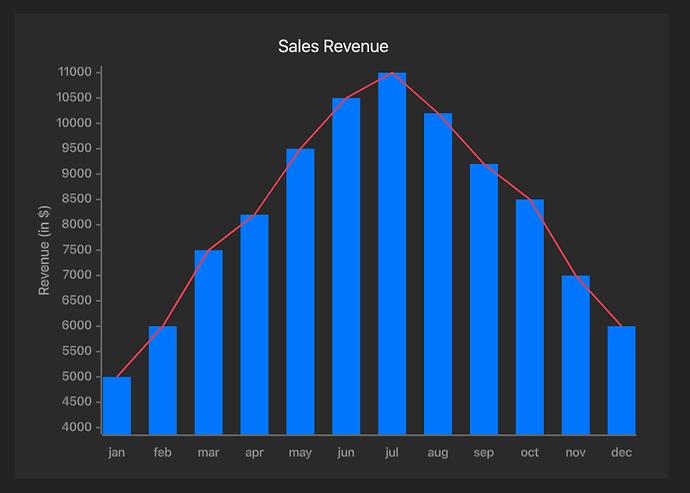
I noticed, that the line chart didn’t show in Obsidian’s default rendering of the example. (Bug?) So I experimented a bit more.

.mermaid svg[aria-roledescription="xychart"] {

  /* add spacious Obsidian background */
  padding: 1rem 2rem 1rem 1rem;
  background-color: var(--background-secondary);

  & g.main {

    /* hide Mermaid background */
    & rect.background {
      opacity: 0;
    }

    & g.plot {

      /* bar chart */
      & rect {
        fill: var(--color-blue) !important;
      }

      /* line chart */
      & path {
        stroke: var(--color-red) !important;
      }
    }

    /* choose color for axes */
    & g.bottom-axis,
    & g.left-axis {

      & path,
      & g.label text,
      & g.title text {
        stroke: var(--text-faint) !important;
      }
    }

    /* no ticks on bottom axis */
    & g.bottom-axis g.ticks{
        display: none;
    }  
  }
}

It turns out that Obsidian’s HTML has more useful selectors than I remembered. :upside_down_face:

Note that no color is hard-coded. I use Obsidian’s variables.

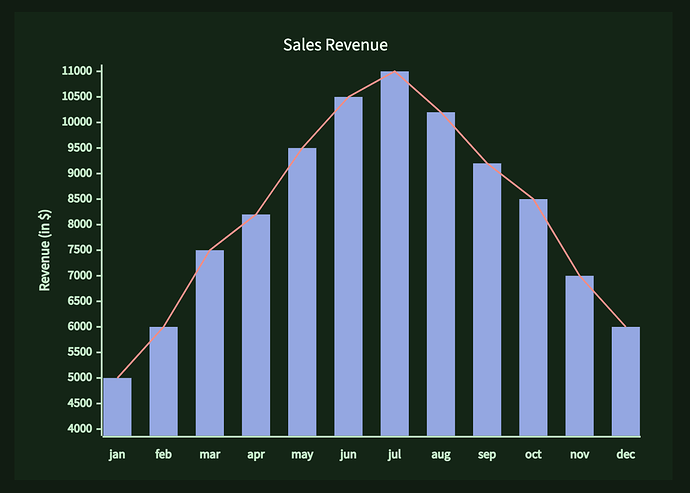
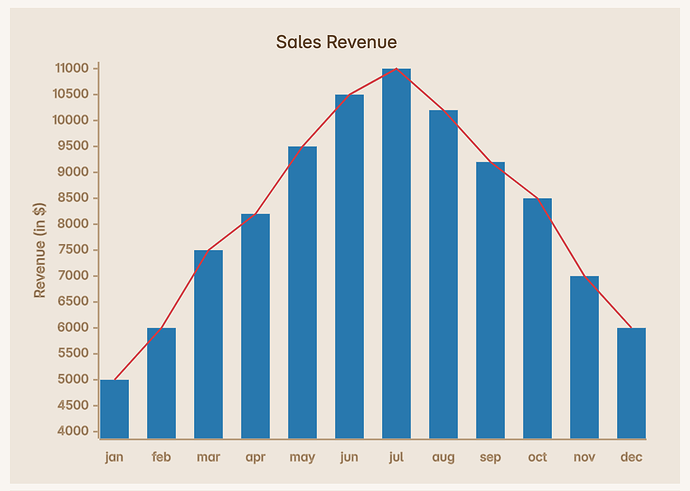
The screenshots show the same CSS with different theme settings. The first shows Default theme in dark mode, the second Prism theme in dark mode with color scheme Pine, the third Primary theme in light mode.

The chart data is the same as in OP’s question.

1 Like

Wow, this is perfect!

You gave me more than I asked for.
Thanks again!

This topic was automatically closed 28 days after the last reply. New replies are no longer allowed.