Use case or problem
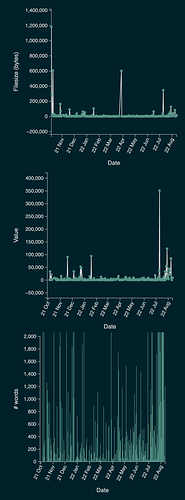
I would like to visually see how many new files I have created on a given day in a particular folder or with a particular tag in comparison with other days. It would help me plan my work, because I would be able to easily spot during which days of the week I am the most productive and how many new files for certain project or topic I can reasonably expect to create per day in the future.
Proposed solution
I prefer form of a bar chart based on the date when the given file was created. It should be possible to select folder or tag of the files I want to visualise. - So the graph will not be vault-wide if I do not want it.
Current workaround
Currently, I am using tables generated by Dataview. I can manually count from them how many new files were created on a given day and copy this value to graph, but I think automatic analytics would save time not only for me. + It is much easier to get general overview from concise visual graph than from long table with numbers.
This “internal analytics” can also be expanded in order to work with modified files, more folders or more tags at the same time and different time scales (week, month, specific time period) etc.
