I have a pretty rudimentary mood tracking process that I use. It’s not for everyone I’m sure, but it works for me. Essentially what I have is a set of PNG images saved and I use the ! command to insert a particular image into a daily note to document my mood for the day (e.g., happy.png, etc.).
What I’d like to do is find a way to create a graph or chart that will show each time a particular image is used in a note, so that I can see when my mood was happy, sad, etc.
Things I have tried
I’ve played around with the Obsidian Charts plugin as well as the Tracker Plugin. I’ve watched a number of YouTube videos on the subject but none seem to really meet my needs. I’ve also tried a few Mood Tracking Plugins which seem good but again, don’t really fit my needs.
Any help would be appreciated. I’m new to Obsidian, and my Java/Dataview/YAML experience is limited.
When you embedded images in a file, they get listed in the file.outlinks metadata, and from there it should be possible to do some filtering and manipulating to get a count of the various images.
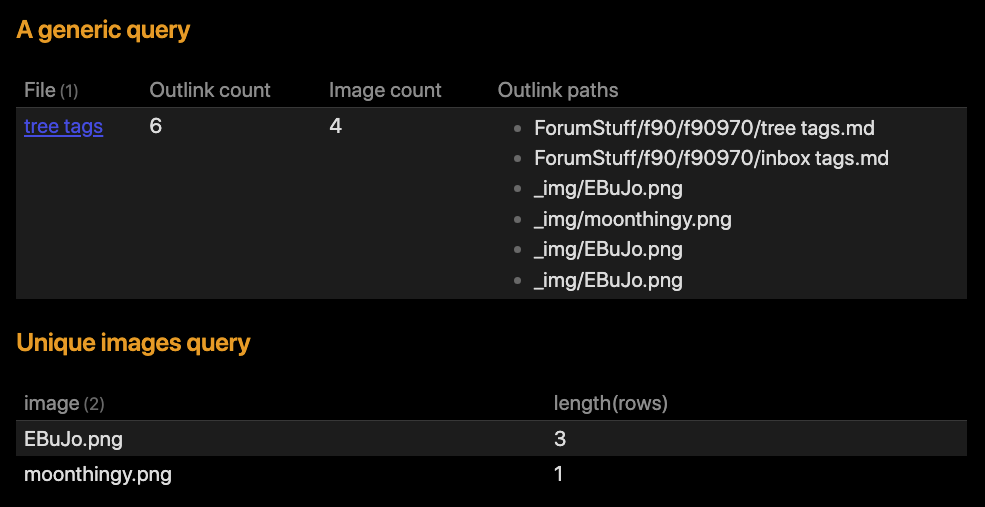
So I created a test files with 4 images, and a few extra outlinks, and than these queries within that specific file:
## A generic query

```dataview
TABLE length(file.outlinks) as "Outlink count",
  length(filter(file.outlinks, (ol) => meta(ol).embed)) as "Image count",
  map(file.outlinks, (ol) => meta(ol).path) as "Outlink paths"
WHERE file = this.file
```

## Unique images query
```dataview
TABLE length(rows)
WHERE file = this.file
FLATTEN filter(file.outlinks, (ol) => meta(ol).embed) as outlink
GROUP BY meta(outlink).display as image
```
I imagine you should be able to use similar code to extract the various mood images you’ve used in your daily notes. I don’t know enough of your setup, to go too much further, but hopefully this gives you some idea on how to progress…