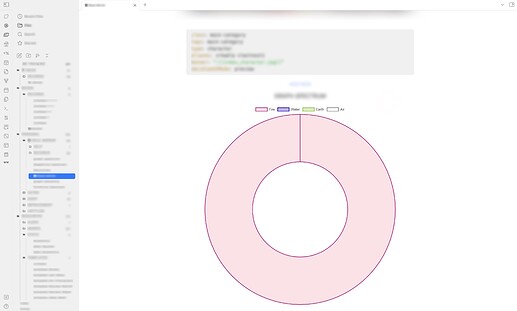
Problem
I haven’t find the way how to resize the graph to 50%. I checked documentation of the
used JS Library: Chart.js | Chart.js, but I cannot find any solutions.
Code
```dataviewjs

// First, get all notes:
const notes = dv.pages();

const element_fire = dv.pages().where(f => f.element == "fire").length;
const element_water = dv.pages().where(f => f.element == "water").length;
const element_earth = dv.pages().where(f => f.element == "earth").length;
const element_air = dv.pages().where(f => f.element == "air").length;

// ... and put those in an array for later visualization:
const dataArray = [element_fire, element_water, element_earth, element_air];

// Now let's setup the data for the chart:
const chartData = {
   labels: ['Fire', 'Water', 'Earth', 'Air'],
   datasets: [
      {
         label: "Elements distribution",
         legend: false,
         data: dataArray,
         backgroundColor: [
            'rgba(255, 99, 132, 0.2)',
            'rgba(32, 0, 192, 0.3)',
            'rgba(128, 192, 32, 0.3)',
            'rgba(255, 255, 255, 0.2)',
         ],
         borderColor: [
            'rgba(192, 0, 128, 1.0)',
            'rgba(32, 0, 192, 1.0)',
            'rgba(128, 192, 32, 1.0)',
            'rgba(128, 128, 128, 1)',
         ],
         borderWidth: 2
      }
   ]
}

// Let's configure the chart:
const config = {
   type: 'bar',
   data: chartData,
label: {
    display: false,
}

}

// Lastly, let's render the chart:
window.renderChart(config, this.container)
Current Output
Desired Output
- centered and 50% smaller graph
