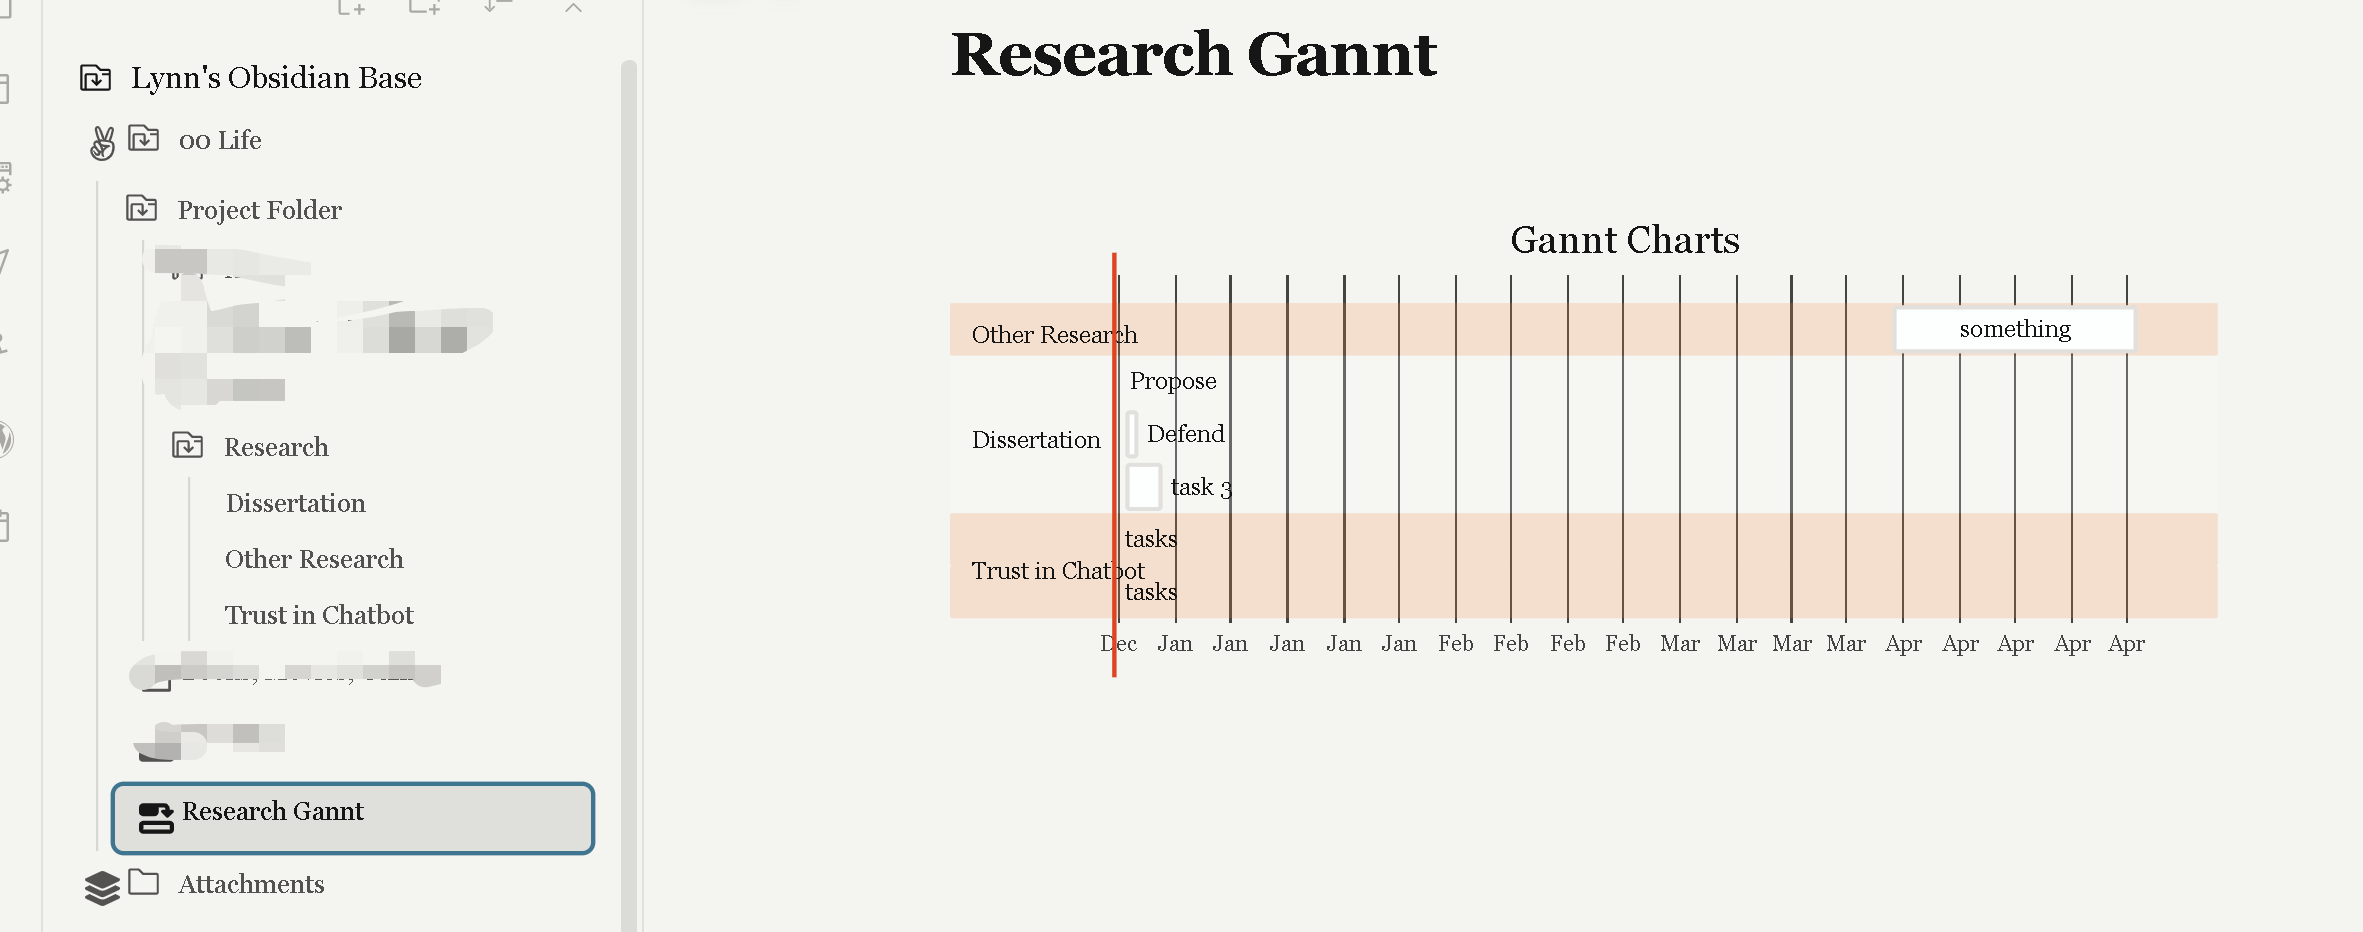
Hey there @boomshakalaka
Since the previous posts on this subject, I made this into a CustomJS user script. I find it more convenient. I call the script from within my daily note template like so:
let today = "{{date:YYYY-MM-DD}}";
let tomorrow = "{{date+1:YYYY-MM-DD}}";
let showDone = dv.current().showDone;

function checkAndExecuteGantt() {
    const { dailyGantt } = customJS || {};
    if (dailyGantt && dailyGantt.drawGantt) {
        let parsedToday = new Date(today);
        if (parsedToday.getDay() != 0) {
            dailyGantt.drawGantt(dv, today, tomorrow, moment, showDone);
        }
    } else {
        setTimeout(checkAndExecuteGantt, 500);
    }
}
checkAndExecuteGantt();
and here is the script itself:
class dailyGantt{
isValidDate(d) {
return d instanceof Date && !isNaN(d);
}
createDateFromString(dateStr) {
if (!/^\d{4}-\d{2}-\d{2}$/.test(dateStr.trim())) {
console.error("Date string format is incorrect:", dateStr);
return null;
}
const [year, month, day] = dateStr.split('-').map(Number);
const date = new Date(year, month - 1, day); // month is zero-indexed, day is one-indexed
if (!this.isValidDate(date)) {
console.error ("function createDateFromString() — Failed to create a valid date from:", dateStr, "— returning null");
return null;
}
return date;
}
extractDate(emoji, taskText) {
const start = taskText.indexOf(emoji);
if (start < 0) {
return "";
}
const match = taskText.slice(start + 1).match(/([12]\d{3}-(0[1-9]|1[0-2])-(0[1-9]|[12]\d|3[01]))(\s|$)/);
return match ? match[0] : "";
}
textParser(taskText, noteCreationDate) {
const emojis = ["📅", "⏳", "🛫", "➕", "✅", "⏫", "🔼", "🔽"];
const DueText = this.extractDate("📅", taskText);
const scheduledText = this.extractDate("⏳", taskText);
const startText = this.extractDate("🛫", taskText);
let addText = this.extractDate("➕", taskText);
const doneText = this.extractDate("✅", taskText);
if (addText === "") {
addText = noteCreationDate;
}
let h = taskText.indexOf("⏫");
let m = taskText.indexOf("🔼");
let l = taskText.indexOf("🔽");
let PriorityText="";
if(h>=0){
PriorityText="High";
}
if(m>=0){
PriorityText="Medium";
}
if(l>=0){
PriorityText="Low";
}
const emojisIndex = emojis.map(emoji => taskText.indexOf(emoji)).filter(index => index >= 0);
let words;
if (emojisIndex.length > 0) {
words = taskText.slice(0, Math.min(...emojisIndex)).split(" ");
} else {
words = taskText.split(" ");
}
words = words.filter((word) => (word) !== "#task");
let newWords = words.map(
(word) => word.startsWith("#") ? `{${word.slice(1)}}` : word);
let nameText = newWords.join(" ");
return {
add: addText,
done: doneText,
due: DueText,
name: nameText,
priority: PriorityText,
scheduled: scheduledText,
start: startText
};
}
loopGantt (args){
const { pageArray, showDone, today, tomorrow, moment } = args;
let queryGlobal = "";
let i;
for (i = 0; i < pageArray.length; i+=1) {
let taskQuery = "";
if (!pageArray[i].file.tasks || pageArray[i].file.tasks.length === 0) {
continue;
}
let taskArray = pageArray[i].file.tasks;
let taskObjs = [];
let noteCreationDate = moment(pageArray[i].file.cday).format('YYYY-MM-DD');
let j;
for (j = 0; j < taskArray.length; j+=1){
taskObjs[j] = this.textParser(taskArray[j].text, noteCreationDate);
let theTask = taskObjs[j];
let monthLater = new Date(today);
monthLater.setDate(monthLater.getDate() + 30);
monthLater = monthLater.toISOString().slice(0, 10);
let monthBefore = new Date(today);
monthBefore.setDate(monthBefore.getDate() + 30);
monthBefore = monthBefore.toISOString().slice(0, 10);
monthLater = this.createDateFromString(monthLater);
if (!monthLater) {
console.error("Failed to create a valid date from monthLater:", monthLater);
}
if (theTask.name === "") continue;
if (!showDone && theTask.done) continue;
if (theTask.name.includes("⛔")) continue;
let taskName = theTask.name
.replace(/:/g, '') // Removes colons
.replace(/\(http[^\)]+\)/g, '') // Removes anything that starts with "(http" and ends with ")"
.replace(/\(file[^\)]+\)/g, '') // Removes anything that starts with "(http" and ends with ")"
.replace(/\(obsidian[^\)]+\)/g, '') // Removes anything that starts with "(http" and ends with ")"
.replace(/\[\[[^\|]+\|/g, '') // Removes wiki link aliases "[[...|"
.replace(/\]\]/g, '') // Removes "]]"
.replace(/\[|\]/g, '') // Removes "[" and "]"
.replace(/\(file[^\)]+\)/g, ''); // Removes anything that starts with "(file" and ends with ")"
let startDate = theTask.start || theTask.scheduled || theTask.add || noteCreationDate || today;
let newStartDate = this.createDateFromString(startDate);
if (!newStartDate) {
console.error("Failed to create a valid date from startDate: ", startDate);
} else {
startDate = newStartDate;
}
if (startDate > monthLater) continue;
if (startDate < monthBefore) continue;
let endDate = theTask.done || theTask.due || theTask.scheduled;
if (!endDate) {
if (startDate >= today) {
let weekLater = new Date(startDate);
weekLater.setDate(weekLater.getDate() + 7);
endDate = weekLater.toISOString().slice(0, 10);
endDate = this.createDateFromString(endDate);
if (!endDate) {
console.error("Failed to create a valid date from weekLater:", weekLater);
}
} else {
endDate = tomorrow;
endDate = this.createDateFromString(endDate);
if (!endDate) {
console.error("Failed to create a valid date from tomorrow:", tomorrow);
}
}
}
// Handling tasks with only a due date and no start date
if (!theTask.start && !theTask.scheduled && theTask.due) {
let weekBefore = new Date(theTask.due);
weekBefore.setDate(weekBefore.getDate() - 7);
startDate = weekBefore.toISOString().slice(0, 10);
newStartDate = this.createDateFromString(startDate);
if (!newStartDate) {
console.error("Failed to create a valid date from weekBefore:", weekBefore);
} else {
startDate = newStartDate;
}
}
if (endDate == startDate) {
let weekLater = new Date(startDate);
weekLater.setDate(weekLater.getDate() + 7);
endDate = weekLater.toISOString().slice(0, 10);
let newEndDate = this.createDateFromString(endDate);
if (!newEndDate) {
console.error("Failed to create a valid date from weekLater:", weekLater);
} else {
endDate = newEndDate;
}
}
// mise des tâches au format mermaid
if (theTask.due){
if (theTask.due < today){
taskQuery += taskName + ` :crit, ` + startDate + `, ` + endDate + `\n\n`;
} else {
taskQuery += taskName + ` :active, ` + startDate + `, ` + endDate + `\n\n`;
}
} else if (theTask.scheduled){
if (startDate >= today){
taskQuery += taskName + ` :active, ` + startDate + `, ` + endDate + `\n\n`;
} else {
taskQuery += taskName + ` :inactive, ` + startDate + `, ` + endDate + `\n\n`;
}
} else {
taskQuery += taskName + ` :active, ` + startDate + `, ` + endDate + `\n\n`;
}
}
queryGlobal += taskQuery;
}
return queryGlobal;
}
drawGantt(dv, today, tomorrow, moment, showDone) {
const Mermaid = `gantt
dateFormat YYYY-MM-DD
axisFormat %b\n %d
`;
// Get all dashboard pages with status "en cours" (ongoing)
let dashboardPages = dv.pages().where(p => (p.status == "en cours" || p.status == "permanent") && p.type == "dashboard");
// Extract tagNames from these dashboard pages
let tagNames = dashboardPages.map(page => page.tagName);
// Get all pages that contain tasks with the extracted tagNames and #task
let filteredPages = [];
for (let page of dv.pages()) {
let tasks = page.file.tasks.filter(t =>
t.status != "-" &&
t.text.includes("#task") &&
tagNames.some(tag => t.text.includes(tag)) &&
!t.text.includes("#someday") &&
!t.text.includes("#waitingFor") &&
!t.text.includes("Revue hebdomadaire")
);
if (tasks.length > 0) {
filteredPages.push({ ...page, file: { ...page.file, tasks: tasks } });
}
}
let ganttOutput = this.loopGantt({pageArray:filteredPages, showDone, today, tomorrow, moment});
// console.log(ganttOutput);
ganttOutput += "🧘🏻♂️ :active, " + today + ", " + today + "\n\n"; // (dummy task to display today's date)
dv.paragraph("```mermaid\n" +
Mermaid +
ganttOutput +
"\n```");
// this prints a meta-bind inline field allowing the user to toggle a boolean in the metadata and thus show/hide completed tasks:
//dv.paragraph(`Montrer les tâches terminées \`INPUT[toggle:showDone]\``);
}
}
edit: a few corrections brought to the script a few months later
another edit: update to fix date creation logic broken by some change somewhere else + hide blocked tasks
Let me know if you could adapt it to your use case.