Maybe you could try using tasks since you can query tasks by tags, storing your data via inline metadata syntax, but I’m not exactly sure if it is possible to have dataviewjs manipulate the stored data and display results in this way. It would seem that if this technique is not possible that there is likely another way. I’d be very interested to hear how it could be accomplished. You might want to ask on the Dataview GitHub as well. I received some very useful guidance there before. That being said, I have a feeling the answer is already posted somewhere on this forum, or someone will respond soon with a solid answer.
My answer isn’t related with graphs or similar, only about the way you can play with lists items in dataview.
Related with metadata structure, lists work as tasks. This means that you can query for lists based in data at lists level.
Take in consideration examples bellow:
note 1
- #fitness running 6.00km in 33:30m
- other thing
note 2
- #fitness running 5.00km in 26:30m
- other exercise
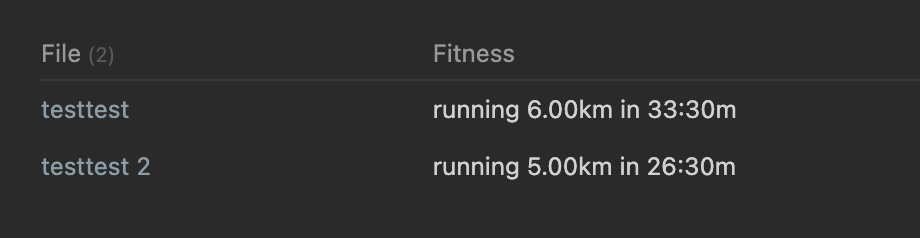
the query
TABLE replace(Li.text, Li.tags, "") AS Fitness
FROM "your-folder-path"
WHERE file.lists
FLATTEN file.lists AS Li
WHERE contains(Li.tags, "#fitness")
(adapt FROM "your-folder-path" with your real folder path. you can also add a tag to a more accurate source filtering FROM "your-folder-path" AND #fitness)
This already got me closer to what I want to achieve. Now I at least have the data that I want.
Just need to manipulate it (possibly with dataviewjs) and pass it to the graph.
I’ll work on it when I find the time and post here with my results.