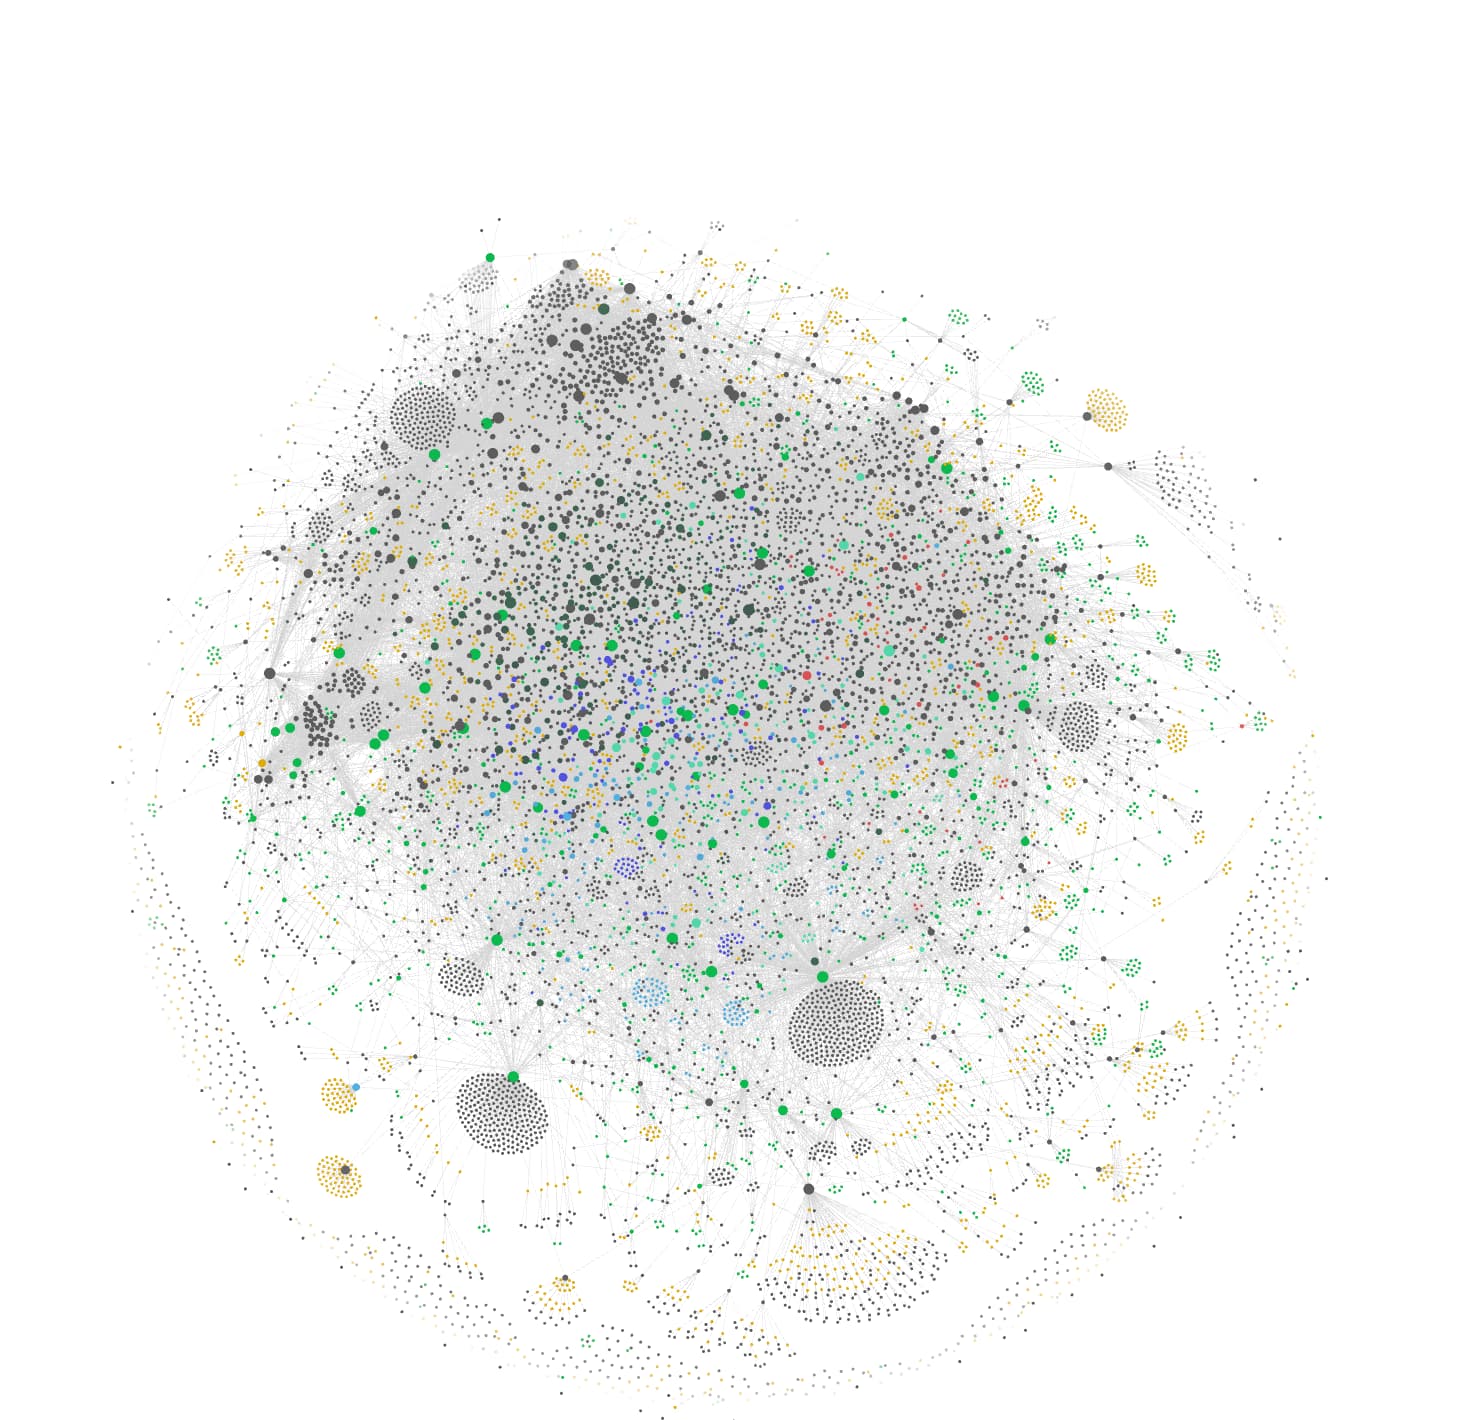
The Graph view is great for just seeing what your biggest interests are, you can see areas grow over time, i find it interesting. The other day i was searching for notes with multiple tags and when the graph got filtered i had a nose around
Well the reason that standard graph view is not useful is because it represents ideas as a network but doesn’t apply any network science metrics to them. It looks pretty but you can’t really get any insights from it because it’s just a visualization with no additional information or interpretation layer on top.
This is one of the reasons why I created a graph view plugin that’s actually based on network science.
It identifies the main topics (so you can get a good overview of the main clusters of ideas), identifies the gaps between them (so you can generate insights by bridging those gaps), and can be used to visualize only the files you choose, search results, or bookmark groups, which is great for getting an insight into a portion of your knowledge (the whole vault might be too big).
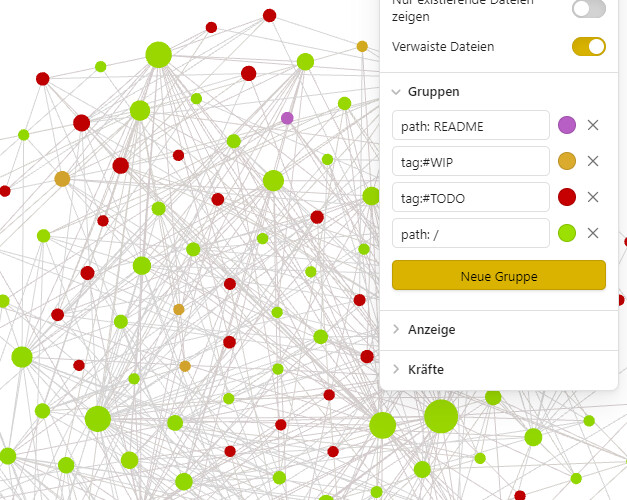
To add my two cents here, I actually found the Graph View very helpful lately, while translating the Obsidian help files. The article about Graph View was one of the first I chose to work on, therefore I got motivated to instantly apply what I had just learned.
This way I can see which files are being edited, already done or still waiting for translation. Also it helps to decide, which notes to translate next, for I tend to go with the most important ones first, which often is indicated by circle size.
This feature may seem quite useless at first glance, but if you use the settings wisely, there’s probably a variety of fancy ways to help you within your personal Obsidian workflows.
In this special project I keep the Graph open to the right of the note I’m working on. Maybe you can imagine the boost of motivation it gives, while the screen is more and more filling with green dots…
This also applies well for learning; I have a status property which I use and depending on the value I also color the notes to see what subject I have yet to deepen my knowledge in. Notes that are bigger of course also have more relevance for learning, so, functionally @Mephi and I have the same use case for the graph view. Other than that I also like to use it to just get a feel of what things are relevant and how much what kind of subjects take up in my vault, in which case I base the colors on tags.