Update: I snatched some code from another post I found online for dataview for generating a table:
TABLE
    length(rows) as "Instances",
	join(rows.file.link, ", ") as "Notes"
WHERE
    characters
FLATTEN
    characters
GROUP BY
    join(characters, ", ") as "Characters"
This renders beautifully as this table:
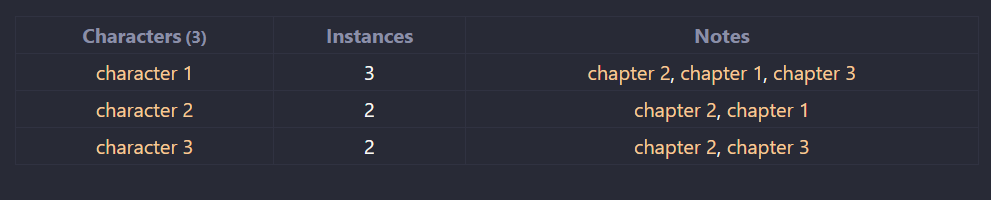
Now, everything I have seen with obsidian-charts has been utilizing dataviewjs to create a chart from a table. Is there anything that can just grab a regular dataview table and plop it into a chart? Or is that not possible. Obviously, the Notes section of this chart would not be particularly necessary just for tracking character occurrences. If this is only possible with dataviewjs, would someone mind tipping me off on how to get started with that? I have a little bit of experience with c++, so hopefully that would come in handy.