What I’m trying to do
As the title suggests, I’m looking to render a chart in which the x axis is a list-type frontmatter property with each metadata value as a different bar on said graph and the y axis is the amount of occurrences of each list value within a targeted folder/group of notes.
Things I have tried
I am a bit of a dataview noob, so I tried that along with different plugins that work with dv and metadata. I tried the Charts plugin but could not get it to work. I tried the Charts View plugin as well but it wasn’t showing occurrences. I also tried the Tracker plugin but I could not get it to work with lists. Part of the struggle I am finding is in looping all list items within a frontmatter property rather than just one specific value. I’ll talk about my use case below.
My use case
I’m creating a writer’s vault and showcasing sections (or chapters) as well as some general data about them (See screenshot below).
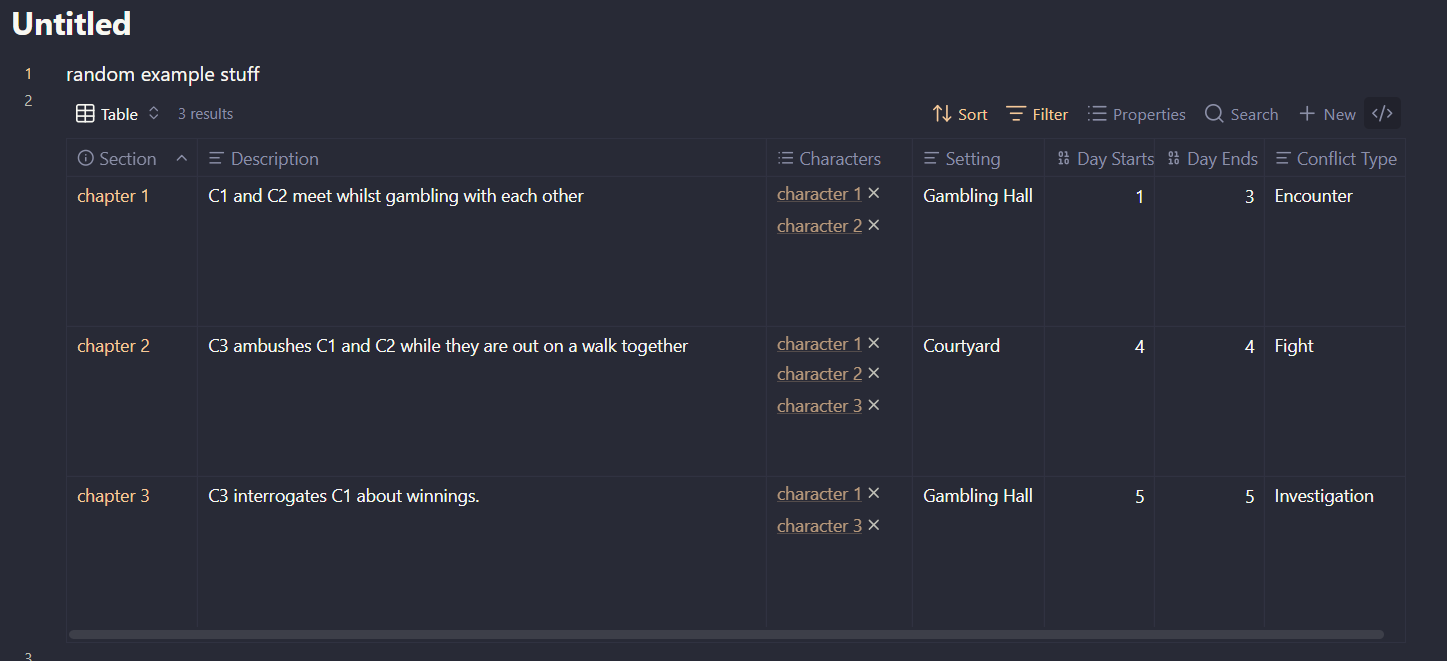
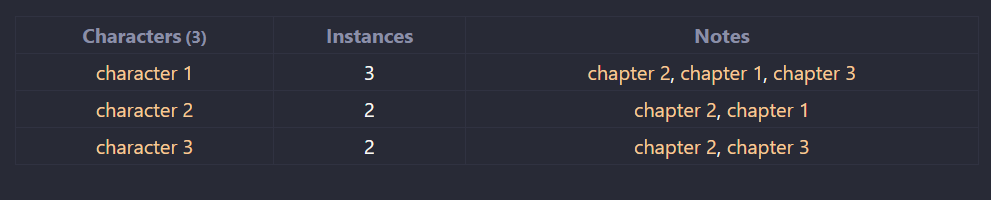
For instance here, I am trying to grab all characters that appear in this arc (collection of chapters) and showcase how many chapters they appear in in comparison with each other. So “character 1” would show up as a bar that counts to 3, “character 2” and “character 3” would each show up on bars that count to 2. Is this kind of thing possible?? It feels like it shouldn’t be that hard.