I use the following Tracker code block which shows me the right number of values at the right dates but it shows wrong values:
``` tracker
searchType: dvField, dvField
searchTarget: DateTime, value
folder: /befundbericht/laborwerte
dateFormat: iso-8601
xDataset: 0
line:
    title: "Line Chart"
```
This code block is within the file/note
befundbericht/laborwert-ids/LDL (Low Density Lipoprotein).md
In the folder /befundbericht/laborwerte are the target files. Each of them contains a blood test value. E.g., the file
befundbericht/laborwerte/1511257020 - LDL (Low Density Lipoprotein).md
with the content:
fromDocument:: [[befundbericht/2017-11-21 Laborarztpraxis XYZ]]
DateTime:: 2017-11-17T10:37
abschnitt::
laborwert:: [[LDL (Low Density Lipoprotein)]]
methode:: PHOT
value:: 105
einheit:: mg/dl
referenzbereich:: < 160
In the same folder are other files for the same DateTime, e.g. the file
befundbericht/laborwerte/1511257020 - HDL (High Density Lipoprotein).md
with the content:
fromDocument:: [[befundbericht/2017-11-21 Laborarztpraxis XYZ]]
DateTime:: 2017-11-17T10:37
abschnitt::
laborwert:: [[HDL (High Density Lipoprotein)]]
methode:: PHOT
wert:: 50
einheit:: mg/dl
referenzbereich:: > 40
I want my Tracker code block to show me the values of LDL only. Currently (=with the code block above), Tracker seems to sum up all values it can find for the same DateTime into a single value and to visualize this summed up value. So, I get a graph with completely nuts values:
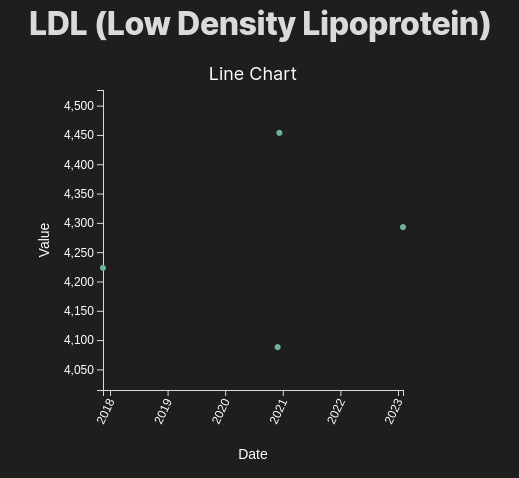
How I can tell Tracker to include files with
laborwert:: [[LDL (Low Density Lipoprotein)]]
only?