I would like to suggest an idea that I have been thinking about for a long time, which has been increasingly occupying my thoughts, and which I believe could be interesting from a visualization standpoint, such as the GraphView.
My idea is to integrate a timeline into the software, allowing for a temporal visualization of all our notes.
I think many of us need to situate events in time. That’s why I’m convinced that this temporal representation in the form of a timeline could be very useful for us. Moreover, with the advent of Canva, I thought that a dedicated interface for a timeline could be possible. I hope I’m not the only one for whom this temporal representation is important.
My dream would be to be able to integrate all my notes into a timeline, to be able to visualize them easily and situate them in time.
*To start with, the simplest thing would be to create a timeline based on the date of creation of our notes. This functionality would probably be feasible given the existence of the “Timelapse” option in GraphView, which already allows for a temporal representation of the creation of our notes. *
However, this idea is rather basic and doesn’t add much. It doesn’t take into account the content of the note.
That’s why the most interesting idea would be to be able to place our notes at a specific date on the timeline. We could use the metadata of the note to define its date.
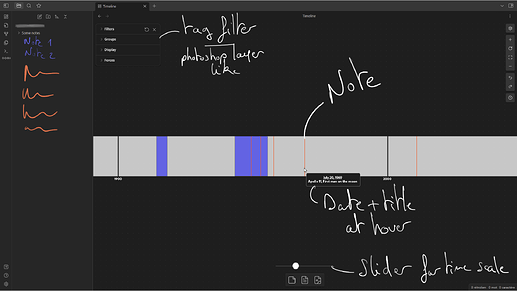
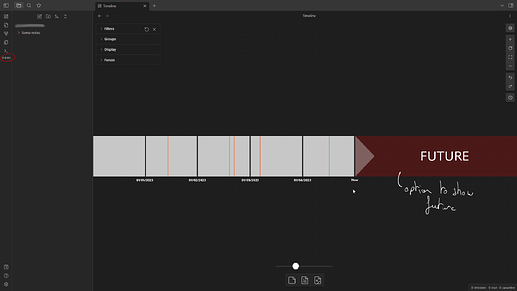
First of all, it’s important to remember that a timeline is composed of different elements: a graduated time bar and markers that represent either a specific moment or a period.
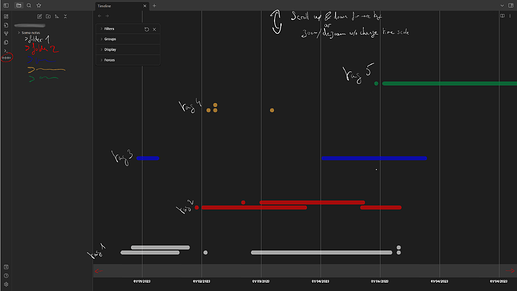
Our time scale would be dynamic, we could zoom in or out in time, similar to what we can see in this video: Time: The History & Future of Everything – Remastered - YouTube.
To facilitate navigation and avoid getting lost in scales that are too large or too small, buttons could be added to directly access a scale by day, month or year, as well as a button to go to a specific date.
Then, events and different periods could be sorted and displayed using the tagging system. This would make it possible to create multiple timelines in one, and why not superimpose them for comparison. A similar system to Photoshop layers could be imagined, although tags are versatile enough to achieve something similar.
There would be several ways to represent this timeline, and it could be quite complex, especially with the use of tags. It could be linear, in the form of a Gantt chart, or even look like a calendar.
Here are some visuals that I have created, they are not perfect, and I do not have the answer to the ideal system.
I am aware that this is very complex, but I am convinced that such a representation has enormous potential combined with the note-taking system of Obsidian, whether for historical events, a personal journal, project management, creating a simple calendar, tracking habits, or even rewinding one’s life.
My perception of time may be personal, but it is such an important thing for me. I need a way to visualize it, and I hope I’m not the only one. That’s why the combination of the Obsidian note-taking system with a timeline seems essential and incredibly powerful.


