I made a yearly calendar based on the Heatmap calendar plugin

Long story short, since I’m a frequent traveler I need to check the dates quickly during the year I’m travelling. I tried to find any good ways to visualise the whole year calendar, but there’s not many options out there. I found the heatmap calendar plugin did something close to my needs, so I adjusted it. This is what it looks like:

My skills of java script are close to zero, so probably this idea could be pushed further. If anyone want to test it or reuse it

main.zip (4.1 KB)

2 Likes

I forgot to add it requires installing Dataview plugin to enable the javascript queries and for the trip files are stored in a Folder named ‘Trips’ and a basic template includes the following metadata:
-–
destination: Portugal
startDate: 2023-01-27
endDate: 2023-01-31
color: green
code: 2
-–

To create the calendar, just create a page with the following content:

```dataviewjs
dv.span(“”) /* optional */
const calendarData = {
year: 2023, // (optional) defaults to current year
colors: { // (optional) defaults to green
gray: [“#dbdbdb”, “#69a3ff”, “#428bff”, “#1872ff”, “#0058e2”],
blue: [“#8cb9ff”, “#69a3ff”, “#428bff”, “#1872ff”, “#0058e2”], // first entry is considered default if supplied
green: [“#c6e48b”, “#7bc96f”, “#49af5d”, “#2e8840”, “#196127”],
red: [“#ff9e82”, “#ff7b55”, “#ff4d1a”, “#e73400”, “#bd2a00”],
orange: [“#ffa244”, “#fd7f00”, “#dd6f00”, “#bf6000”, “#9b4e00”],
pink: [“#ff96cb”, “#ff70b8”, “#ff3a9d”, “#ee0077”, “#c30062”],
orangeToRed: [“#ffdf04”, “#ffbe04”, “#ff9a03”, “#ff6d02”, “#ff2c01”]
},
showCurrentDayBorder: true, // (optional) defaults to true
defaultEntryIntensity: 4, // (optional) defaults to 4
intensityScaleStart: 10, // (optional) defaults to lowest value passed to entries.intensity
intensityScaleEnd: 100, // (optional) defaults to highest value passed to entries.intensity
entries: [], // (required) populated in the DataviewJS loop below
}

//DataviewJS loop
for (let page of dv.pages(‘“Trips”’).where(p => p.code)) {
//dv.span(“
” + Date(page.inbound)) // uncomment for troubleshooting
const startDate = new Date(page.startDate);
const endDate = new Date(page.endDate);
let currentDate = startDate;
const oneDayInMillis = 24 * 60 * 60 * 1000;
while (currentDate <= endDate) {
const day = new Date(currentDate.getTime() + oneDayInMillis);
calendarData.entries.push({
date: day.toISOString().split(‘T’)[0],
intensity: page.code,
color: page.color,
});

    currentDate.setDate(currentDate.getDate() + 1);
}

}

renderHeatmapCalendar(this.container, calendarData)
```

1 Like

Something didn’t paste right with the javascript snippet. Maybe re-attach as a text file or embed as a code block? Looks very cool!

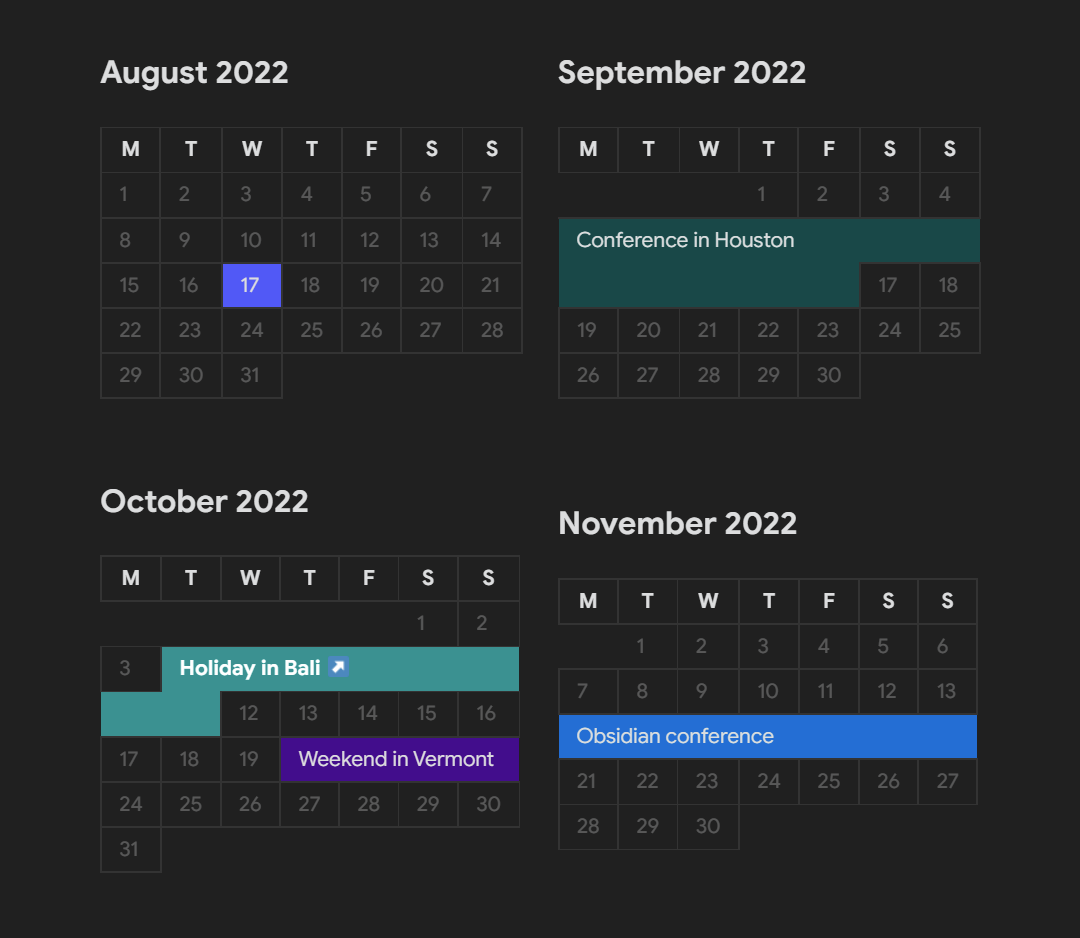
Hi @p3d2 - you might also like to have a look at this one, which was created for visualising travel events over the year:

1 Like