Inspect and Adapt Your Process. About Zettelkasten Analytics

Just a timeline of notes created in different folders. What is it like watching your Zettelkasten grow up?

For me it is rewarding because seeing my Zettelkasten grow is seeing the fruits of my labor. But, it also makes me aware of time and the passage of time and what a short season lifetime is.

What’s your preferred data analytics for using Zettelkasten? Which tools are you using?


More about the 12 Principles For Using Zettelkasten

7 Likes

Hi @Edmund, it looks beautiful. I’ve been using a Zettelkasten system for some time, but had not heard of a plugin to analyse the number of notes in it over time. How did you do it?

1 Like

Thank you for your feedback. I also would like to use a plug-in. It’s really missing. So I had to count my files on my hard disk in the separated folders. But I’m sure there will be a better option. :wink:

1 Like

Woh, you counted all of it and plotted by day! Too tedious for me. Yeah, perhaps someday someone will come up with a plugin :crossed_fingers:

1 Like

I just started creating a proper Zettelkasten a few months ago, and I wanted to do exactly this: graph the growth of my “database” over time. I use the Dataview and Obsidian Charts plugins to accomplish this. It’s not as pretty as Edmund’s illustration, but it is useful:

The table at the top is notes created in the last day, things I’m currently thinking about (although this is flexible, sometimes I like to see a couple of days at a time). I use this for reviewing and building on current ideas.

Then the first graph is notes created per day, and the second graph is notes created over time, followed by a total. It’s simple, but it’s motivating to see it grow. This works better for me to watch growth than the graph view, I find the graph view a bit too chaotic for that.

I don’t distinguish between fleeting and permanent notes: I keep my fleeting notes in a separate folder, and I try to empty that folder at the end of every day. My goal is to never wait more than a day or two before refactoring a fleeting note into permanent ones, so that I don’t lose the original idea.

3 Likes

Yes indeed. And there is the Dataview plugin to automate all the booring stuff. With PowerBI in a next step you then create all the charts you need to answer your analytics questions.

Thank you for this great idea to use the Dataview plugin. Now it’s easy for me to do some additional analytics. My questions was:

“What’s my preferred time for thinking?”

Here’s the result from my vault.

4 Likes

But starting with one question always gives the chance to ask a second one:

“What is my preferred day for thinking? Is there someting like a relaxed weekend?”

Hint: Monday = 0

2 Likes

Can you share your dataview queries? I am a little lost how to do that kind of analytics. :frowning:

1 Like

Here’s my Dataview code:

TABLE file.ctime AS "created", 
file.mtime AS "modified", 
file.folder AS "folder" 
SORT file.mtime DESC

Dataview delivers a table with data.

4 Likes

I use a fairly complex DataviewJS script. I fine tuned it to my situation, but I suspect it could work for others with a few tweaks.

My vault has a lot of content that I don’t consider zettels, so my script specifically looks for notes with a “date” field, that’s how I distinguish between my zettels and other content. I use this string in my zettel template to create the correct date format:

---
date: {{date:YYYYMMDD}}{{time:HHmm}}
---

This is the date I query off of, because I’ve found Dataview’s “cdate” field to be unreliable. It works better to include the string in each note. I also check certain configurable folders for efficiency (for me, my “Umami” and “Fleeting” folders).

And here is my script for creating the table and graphs (you’ll need both the Dataview and Obsidian Charts plugins installed and active). “daysback” controls the date range for the table, and “chartlength” controls the date range for both charts.

daysback:: 3
chartlength:: 100
location:: "Umami" OR "Fleeting"

```dataviewjs

var start = moment().startOf('day');
var dateformat = "YYYYMMDDhhmm";
var daysback = (dv.current().daysback) || 2;
var location = dv.current().location || '';
var chartlength = dv.current().chartlength || 50;
var docs = dv.pages(location);

function getRecentDocs(numDays) {
	// this function finds recently created docs
	// it uses a where function to return a collection
	// based on days in the past
	return docs
		.where(f => {
			if (!f.date) return false;
			var pastDate = moment(start).subtract(numDays, 'days');
			var docDate = moment(f.date, dateformat);
			return docDate.isAfter(pastDate);
		});
}


// creating the table
var ztDocs = getRecentDocs(daysback);
dv.table(['link', 'date'], ztDocs
	.sort(f => -f.date)
	.map(b => [b.file.link, moment(b.date, dateformat).format('YYYY-MM-DD hh:mm')]));


// creating the charts
var ztLastWeek = getRecentDocs(chartlength).sort(f => f.date);
var daysData = [];
var totalcount = 0;

// formatting the data
for (var i=0; i<=ztLastWeek.length; i++) {
	var f = ztLastWeek[i];
	if (f && f.date) {
		var itemDate = moment(f.date, dateformat);
		var newDate = itemDate.format('MM-DD');
		var index = daysData.findIndex(d => d.label === newDate);
		if (index !== -1) {
			daysData[index].num += 1;
		} else {
			daysData.push({label: newDate, num: 1});
		}
		totalcount += 1;
	}
};

var labels = [],
	data = [],
	aggData = [];

daysData.map(el => {
	labels.push(el.label);
	data.push(el.num);

	if (aggData.length) {
		var lastNum = aggData[aggData.length - 1];
		aggData.push(el.num + lastNum);
	} else {
		aggData.push(el.num);
	}
});

const lineChart = {
	type: 'line',
	data: {
	labels: labels,
	datasets: [{
		label: 'Docs created',
		data: data,
		backgroundColor: [
			'#4e9a06'
		],
		borderColor: [
			'#4e9a06'
		],
		borderWidth: 1
	}]
   }
}

const aggregateChart = {
	type: 'line',
	data: {
		labels: labels,
		datasets: [{
			label: 'Aggregate Docs Created',
			data: aggData,
			backgroundColor: [
				'#4e9a06'
			],
			borderColor: [
				'#4e9a06'
			],
			borderWidth: 1
		}]
	}
}

// render both charts and a total
window.renderChart(lineChart, this.container);
window.renderChart(aggregateChart, this.container);

dv.paragraph('Total: ' + totalcount);

\```

Not the cleanest code, but it works for me. Let me know if you try it, I’d be interested to see if it works for anyone else!

5 Likes

Thank you for sharing your code. My first thought: :scream:. Do I really need this? But some days later I came back and started thinking about the ‘cdate’ topic. And there is no easy solution. :cry:

I have not looked into Dataview till now. Looks like there is a lot you can do with it.

2 Likes

Yes, it’s working. Thank you for your amazing script. Here are my results:

I’ve made small changes in color and text. Days without data (2023-02-07) are missing in the timeline. They are not set to a value of zero. My experience with JavaScript is limited. Any ideas for improvement?

2 Likes

image

Thank you @webinspect for your examples using Obsidian Charts. I started to use my own scripts and it‘s really fun to create charts automatically.

Today my Zettelkasten in Obsidian is 359 days old. It‘s a great idea to use the DataView plugin for retrieving data from my Zettelkasten and to use the Obsidian Charts as it‘s companion. Once installed and code added it produces data visuals automatically. Here one example: An overview on an indicator like „Productivity“ is good measure to evaluate the Zettelkasten performance.

References

  • John, Doerr. Measure What Matters : OKRs - The Simple Idea That Drives 10x Growth. Portfolio Penguin, 2018.
  • Barron, Jason. The Visual MBA: Two Years of Business School Packed into One Priceless Book of Pure Awesomeness. Boston: Houghton Mifflin Harcourt, 2019.
2 Likes

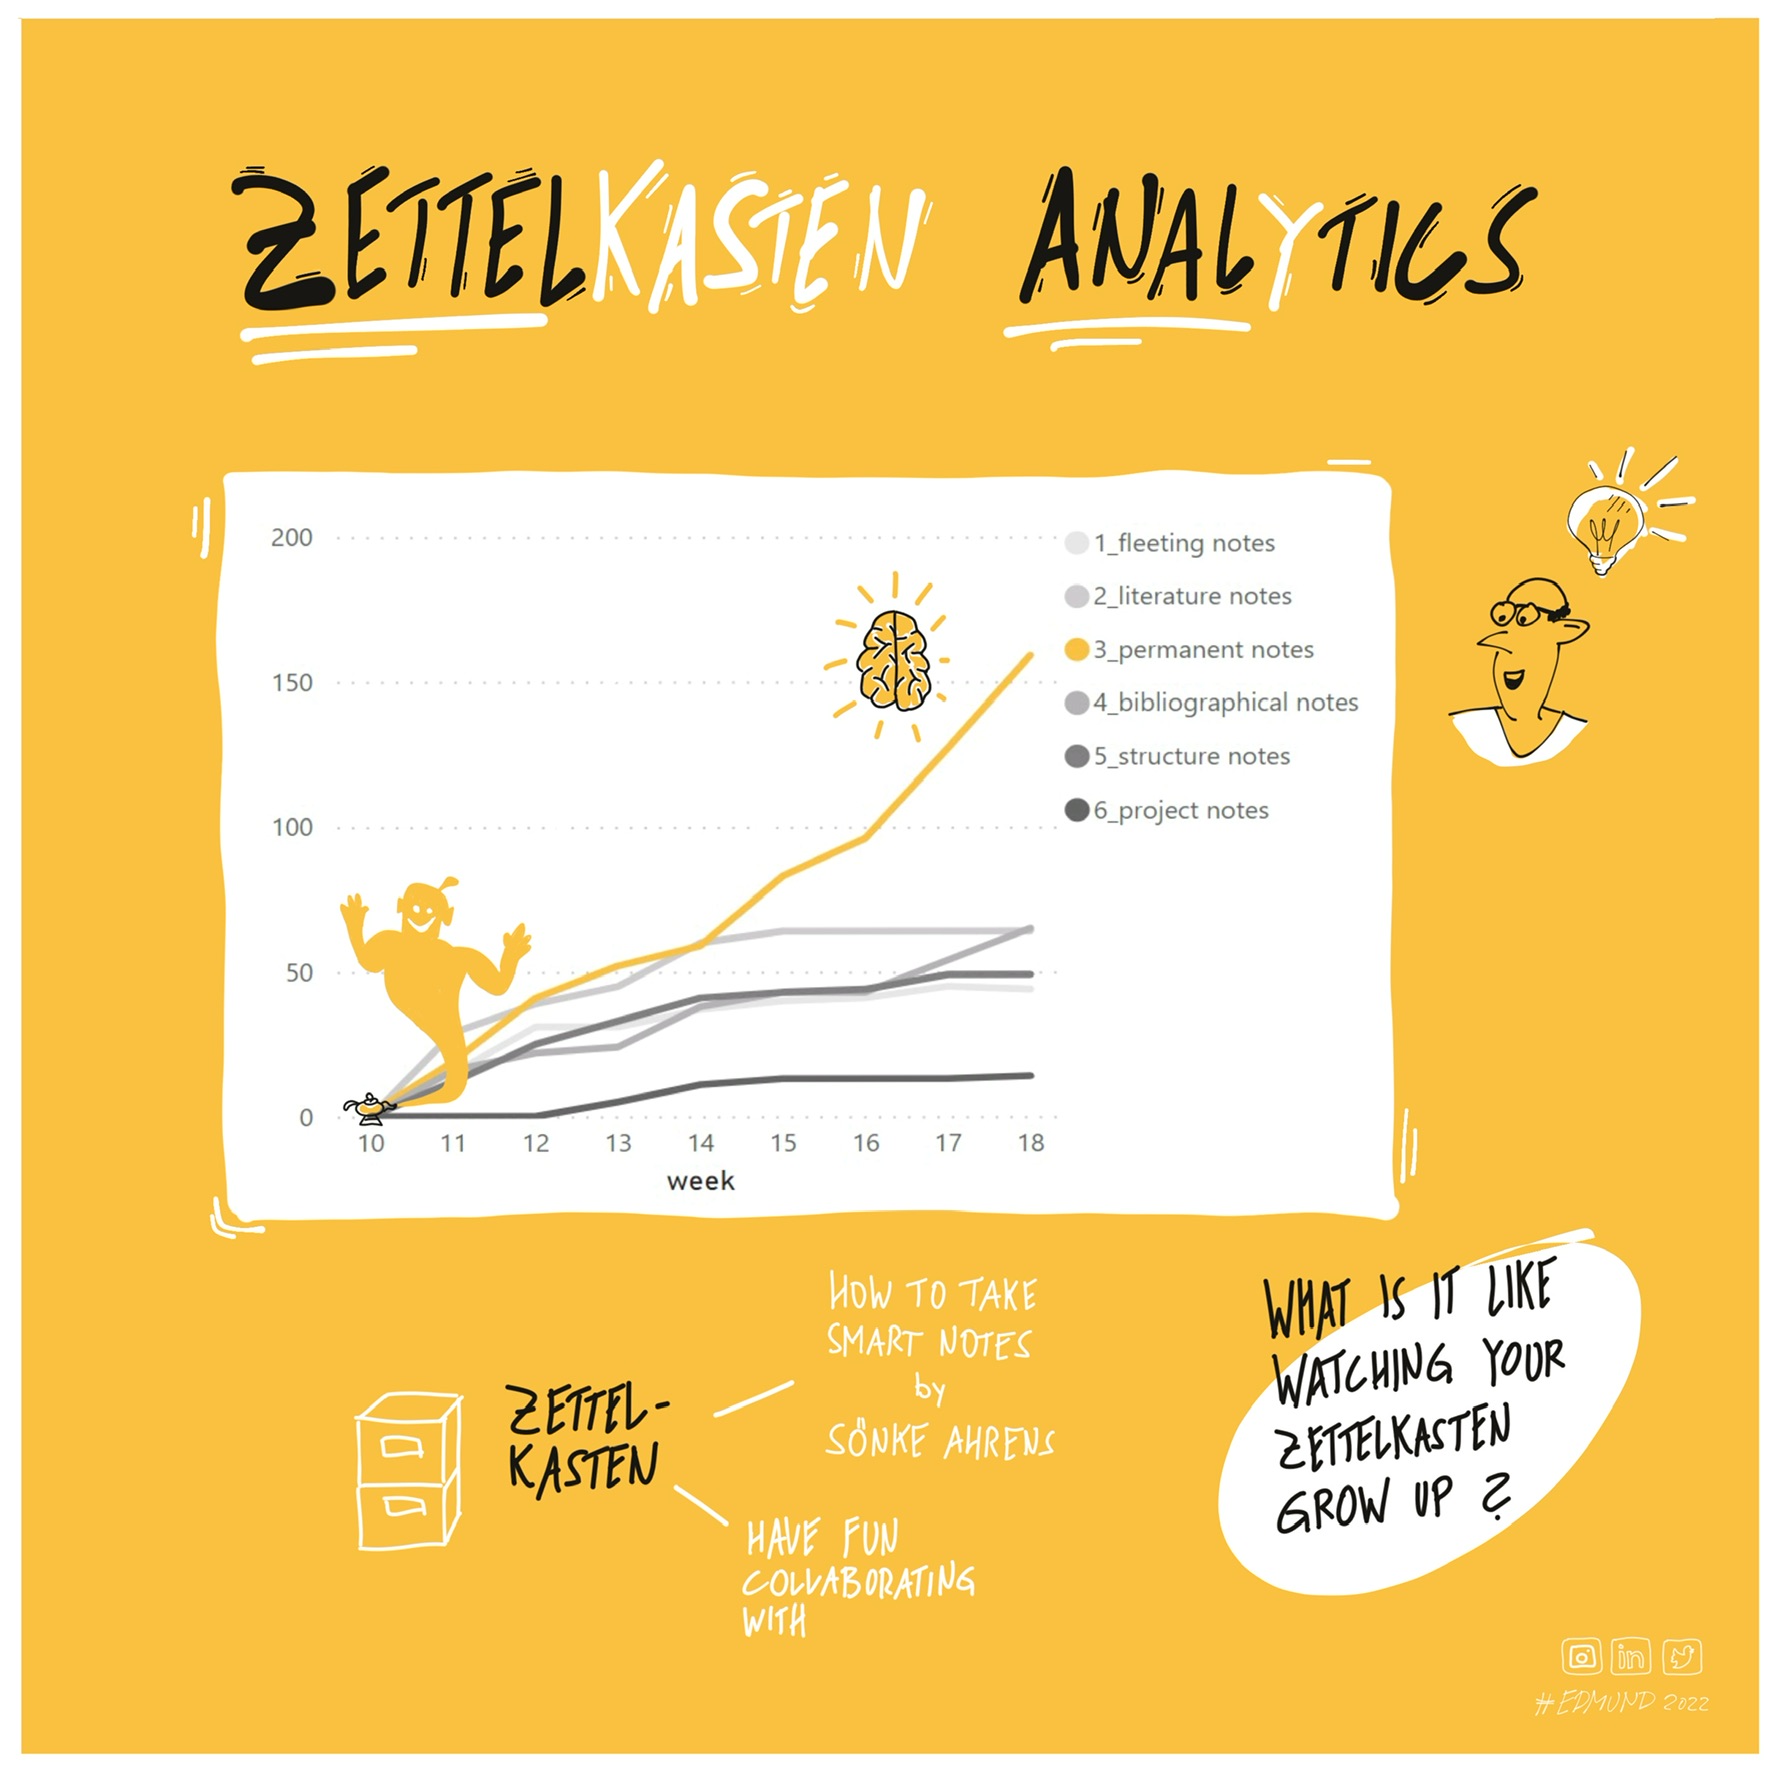
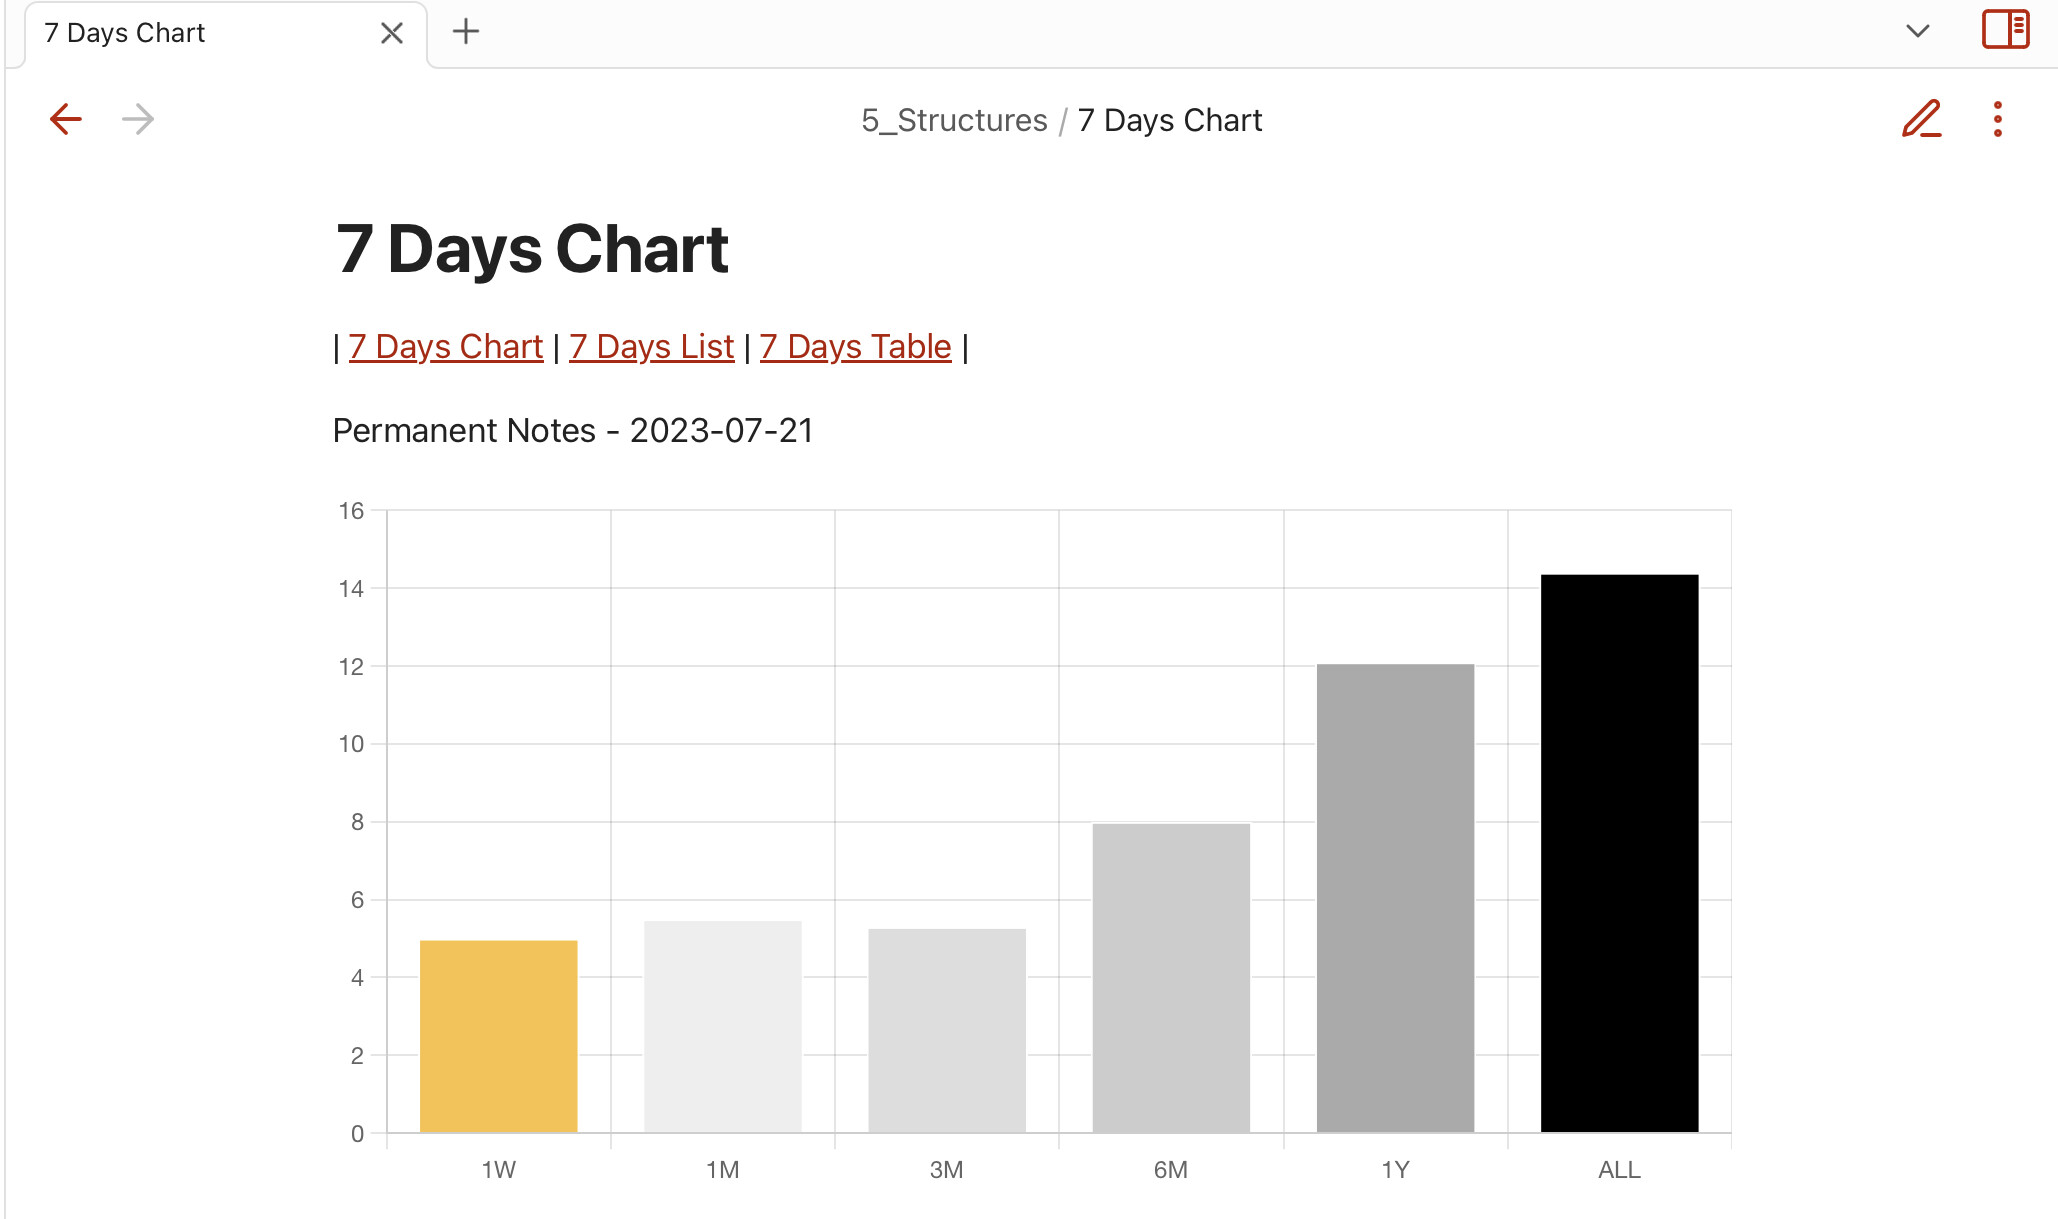
Here’s my latest chart to inspect the progress of my Zettelkasten. It shows the number of notes created within 7 days. You are able to compare the changes for the averages from last week 1W, last month 1M, three month 3M, etc.

All you need is DataView and the Obsidian Charts plugin.


// === 7 Days Chart ===

// --- Age ---
var first_note = "20220307";
var a = moment();
var b = moment(first_note);
var age_years = a.diff(b, 'years');
var age_month = a.diff(b, 'months');
var age_weeks = a.diff(b, 'weeks')
var age_days = a.diff(b, 'days');
var age = a.diff(b, 'days') - 365 * age_years;

// --- Last 7 Days ---
var a = moment().format("YYYY-MM-DD");

var b = moment().subtract(1, 'week');
b = moment(b).format("YYYY-MM-DD");

var c = moment().subtract(1, 'month');
c = moment(c).format("YYYY-MM-DD");

var d = moment().subtract(3, 'month');
d = moment(d).format("YYYY-MM-DD");

var e = moment().subtract(6, 'month');
e = moment(e).format("YYYY-MM-DD");

var f = moment().subtract(1, 'year');
f = moment(f).format("YYYY-MM-DD");

// —— Last 1 Week —-
var count_note_1w = dv
	.pages('"3_Permanent Notes"')	
	.where (p => p.created >= b)
	.length;

// —— Last 1 Month —-
var count_note_1m = dv
	.pages('"3_Permanent Notes"')	
	.where (p => p.created >= c)
	.length;
var count_note_1m_13 = count_note_1m / 52 * 12;
count_note_1m_13 = count_note_1m_13.toFixed(1);

// —— Last 3 Month —-
var count_note_3m = dv
	.pages('"3_Permanent Notes"')	
	.where (p => p.created >= d)
	.length;
var count_note_3m_13 = count_note_3m / 13;
count_note_3m_13 = count_note_3m_13.toFixed(1);

// —— Last 6 Month —-
var count_note_6m = dv
	.pages('"3_Permanent Notes"')	
	.where (p => p.created >= e)
	.length;
var count_note_6m_26 = count_note_6m / 26;
count_note_6m_26 = count_note_6m_26.toFixed(1);

// —— Last 1 Year —-
var count_note_1Y= dv
	.pages('"3_Permanent Notes"')	
	.where (p => p.created >= f)
	.length;
var count_note_1Y_52 = count_note_1Y / 52;
count_note_1Y_52 = count_note_1Y_52.toFixed(1);

// —- Since Start
var count_note_all = dv
	.pages('"3_Permanent Notes"')	
	.length;

var note_per_week = count_note_all / age_weeks;
note_per_week = note_per_week.toFixed(1);

// --- show results ---
dv.paragraph('Permanent Notes per Week - ' + a);

// --- Set Colors ---
const CHART_COLORS = {
	  red: '#B51A00',
	  orange: 'rgb(255, 159, 64)',
	  yellow: '#FAC141',
	  green: 'rgb(75, 192, 192)',
	  blue: '#417CFA',
	  black: '#000000',
	  grey: '#CCCCCC',
	  light_grey: '#DDDDDD',
	  ultralight_grey: '#EEEEEE',
	  dark_grey: '#AAAAAA',
	  white: '#FFFFFF'
	}

const NAMED_COLORS = [
	  CHART_COLORS.red,
	  CHART_COLORS.orange,
	  CHART_COLORS.yellow,
	  CHART_COLORS.green,
	  CHART_COLORS.blue,
	  CHART_COLORS.purple,
	  CHART_COLORS.grey,
	]

// --- Create Chart ---
const chartData = { 
	type: 'bar', 
	data: { 
		labels: [
			'1W', 
			'1M',
			'3M', 
			'6M',
			'1Y',
			'ALL'], 
		datasets: [
			{
			label: 'y',
			data: [count_note_1w, count_note_1m_13, count_note_3m_13, 
				count_note_6m_26, count_note_1Y_52, note_per_week],
			backgroundColor: [
				CHART_COLORS.yellow, 
				CHART_COLORS.ultralight_grey, CHART_COLORS.light_grey, 
				CHART_COLORS.grey, CHART_COLORS.dark_grey, CHART_COLORS.black], 
			borderColor: CHART_COLORS.white, 
			borderWidth: 1
			}
		] 
	},
	options: {
		indexAxis: 'x',
        plugins: {
            title: {
                display: false,
                text: 'Custom Chart Title'
            },
            subtitle: {
                display: false,
                text: 'Custom Chart Subtitle'
            },
            legend: {
	            display: false,
                position: 'right'
            }
        }
    }

} 

window.renderChart(chartData, this.container)

2 Likes

With Dataview we have a great tool for Zettelkasten analytics. Step by step I developed a collection of simple queries for a repeated use to inspect and adapt my Zettelkasten process. Here is my list of:

Tools for Gardening

Process

  • Fleeting Notes to be processed
  • Literature Notes to be processed
  • Imported Notes to be processed
  • Daily Notes to be processed

Links

  • Permanent Notes without in-links
  • Permanent Notes without out-links

Tags

  • Permanent Notes without tags

Tasks

  • Permanent Note tasks to be finished
  • Reference tasks to be finished
  • Structure tasks to be finished
  • Project Note tasks to be finished

Lost and found

  • Permanent Notes without any links
  • Permanent Notes never modified
  • Orphans to be integrated

Thanks to Dataview you can also use this list with actual data as a Zettelkasten Dashboard:

Which of these tools do you regularly use with your own Zettelkasten? Which is missing?

2 Likes

Very interesting @Edmund, could you share the code for some dataview query? I don’t understand how to get the count in the list and I’m curious about where the links in the list items are pointing…thx!

1 Like

@nestorito Have a look at my code created for dataviewjs. I’m sure you will have some ideas for improvement.

// --- Count unfinished notes
var count_fleeting = dv.pages('"1_Fleeting Notes"').length; 
var count_literature = dv.pages('"2_Literature Notes"').length; 
var count_onenote = dv.pages('"OneNote"').length; 
var count_daily = dv.pages('"5_Structures"')
	.where(s => s.tasks >= 1).length;

// --- Count notes in wrong FOLDERS
var count_term = dv.pages('#type/term AND !"4_References"').length;
var count_quote = dv.pages('#type/quote AND !"4_References"').length;
var count_book = dv.pages('#type/book AND !"4_References"').length;
var sum_folders = 
	count_term + count_quote + count_book;

// --- Count notes with MISSING LINKS
var count_zero_in = dv.pages('"3_Permanent Notes"')
	.where(s => s.file.inlinks.length == 0).length;
var count_zero_out = dv.pages('"3_Permanent Notes"')
	.where(s => s.file.outlinks.length == 0).length;
var count_orphan = dv.pages('"3_Permanent Notes"')
	.where(s => s.file.outlinks.length == 0)
	.where(t => t.file.inlinks.length == 0).length;
var count_orphan_2 = dv.pages('"3_Permanent Notes" OR "4_References" OR "5_Structures"')
	.where(s => s.file.tags.length == 0)
	.where(s => s.file.outlinks.length == 0)
	.where(t => t.file.inlinks.length == 0).length;

// --- Count notes without TAGS
var count_tags = dv.pages('"3_Permanent Notes"')
	.where(s => s.file.tags.length == 0).length;

// --- Count unmodified notes
var count_unmodified = dv.pages('"3_Permanent Notes"')
	.where(s => s.modified == s.created).length;

// --- Count tasks
var count_tasks = dv.pages('"3_Permanent Notes"').file.tasks.length;
var count_reference_tasks = dv.pages('"4_References"').file.tasks.length;
var count_structure_tasks = dv.pages('"5_Structures"').file.tasks.length;
var count_project_tasks = dv.pages('"6_Project Notes"').file.tasks.length;

// --- Summarize notes and tasks
var sum_count = 
	count_fleeting + count_literature + count_onenote + count_daily + 
	sum_folders +
	count_zero_in + count_zero_out + count_tags;
var sum_tasks = 
	count_tasks + count_reference_tasks + count_structure_tasks + 
	count_project_tasks;

// --- Show results ---
dv.paragraph(
	'**Workflow**<br>' +
	count_fleeting + ' - [Fleeting Notes to be processed](Fleeting%20Notes%20to%20be%20processed.md)<br>' +
	count_literature + ' - [Literature Notes to be processed](Literature%20Notes%20to%20be%20processed.md)<br>' +
	count_onenote + ' - [Imported Notes to be processed](Imported%20Notes%20to%20be%20processed.md)<br>' +
	count_daily  + ' - [Daily Notes to be processed](Heatmap%20Calendar%20with%20Tasks.md)<br><br>' +

	'**Folders**<br>' +
	sum_folders + ' - [Notes in wrong folders](Notes%20in%20wrong%20folders.md)<br><br>' +
	
	'**Links**<br>' +
	count_zero_in  + ' - [Permanent Notes without in-links](Permanent%20Notes%20without%20in-links.md)<br>' +
	count_zero_out  + ' - [Permanent Notes without out-links](Permanent%20Notes%20without%20out-links.md)<br><br>' +

	'**Tags**<br>' +
	count_tags  + ' - [Permanent Notes without tags](Permanent%20Notes%20without%20tags.md)<br><br>'  +

// ===
	'= **' + sum_count  + ' - Notes to be processed or completed**<br><br>' +
// ===

	'**Tasks**<br>' +
	count_tasks  + ' - [Tasks from Permanent Notes to be finished](Permanent%20Notes%20with%20tasks%20to%20be%20finished.md)<br>'  +
	count_reference_tasks  + ' - [Tasks from References to be finished](Reference%20tasks%20to%20be%20finished.md)<br>'  +
	count_structure_tasks  + ' - [Tasks from Structures to be finished](Structure%20tasks%20to%20be%20finished.md)<br>'  +
	count_project_tasks  + ' - [Tasks from Project Notes to be finished](Project%20Note%20tasks%20to%20be%20finished.md)<br><br>'  +

// ===
	'= **' + sum_tasks +  ' - Tasks to be finished**<br><br>' +
// ===

	'**Lost and found**<br>' +
	count_orphan  + ' - [Permanent Notes without any links](Permanent%20Notes%20without%20any%20links.md) <br>' +
	count_unmodified  + ' - [Permanent Notes never modified](Permanent%20Notes%20never%20modified.md) <br>' +
	count_orphan_2  + ' - [Orphans to be integrated](Orphans%20to%20be%20integrated.md) <br>' 
	);
1 Like

Sometimes charts are better than numbers. But my burndown chart [1] shows me what I’ve never expected: The work remaining is not only very high, it’s hard to prevent it from growing. :frowning:

Any simple rule to adapt my process?

Reference
[1] Schwaber, Ken. Agile Project Management with Scrum. Microsoft Press, 2004, 11-12.

1 Like