I have created a chart showing me multiple datasets. By clicking on the box in the index the dataset can be switched to off or invisible. Is there a way to set these to invisible by default? So that I can add them to the chart if I like, but only then.
Please inform us on which plugin you’ve used to create that chart. That would it make it easier for someone who knows that plugin to answer.
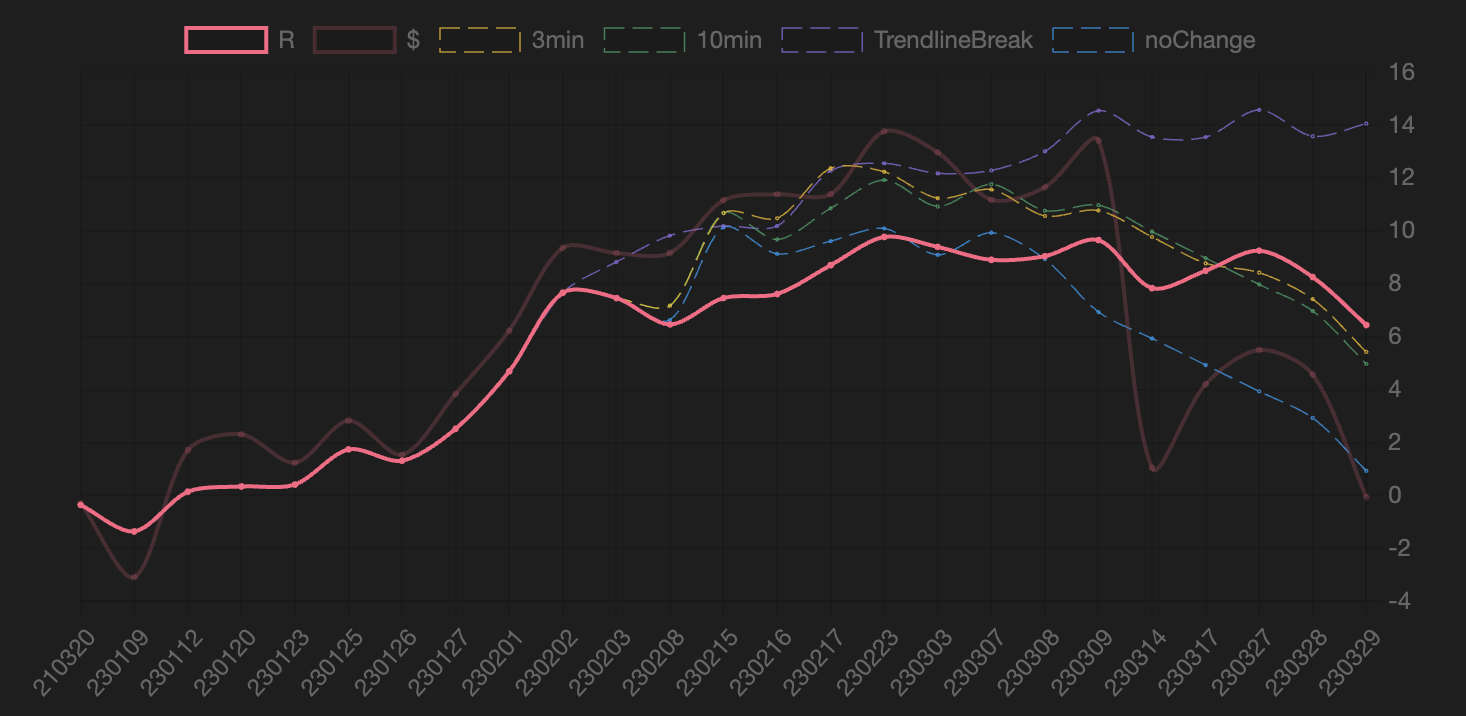
Sure … I use dataviewjs and obsidian charts. Here is the code I created with @holroy’s help.
const pages = dv.pages('"00_Trades"')
	.where(p => p.play == "A_Scenario" && p.subPlay == "openingDrive")
	.sort(p => p.date, "asc")
	.groupBy(p => p.date)

const TradeDate = pages.map(p => p.key).values
const TradeOutcome = pages.map(p => p.rows.values.reduce((tmp, curr) => tmp + curr.outcome, 0)).values
const total = TradeOutcome.reduce((tmp, curr) => tmp + curr, 0)

const Outcome_SL_3min = pages.map(p => p.rows.values.reduce((tmp, curr) => tmp + curr.outcome_SL_3min, 0)).values
const Outcome_SL_10min = pages.map(p => p.rows.values.reduce((tmp, curr) => tmp + curr.outcome_SL_10min, 0)).values
const Outcome_trendlineBreak = pages.map(p => p.rows.values.reduce((tmp, curr) => tmp + curr.outcome_trendlineBreak, 0)).values
const Outcome_noChange = pages.map(p => p.rows.values.reduce((tmp, curr) => tmp + curr.outcome_noChange, 0)).values

let cumulativeOutcome = [ TradeOutcome[0] ]
for (let i = 1; i < TradeOutcome.length; i++) {
  cumulativeOutcome[i] = cumulativeOutcome[i-1] + TradeOutcome[i]
}

let cumulativeOutcome_SL_3min = [ Outcome_SL_3min[0] ]
for (let i = 1; i < Outcome_SL_3min.length; i++) {
  cumulativeOutcome_SL_3min[i] = cumulativeOutcome_SL_3min[i-1] + Outcome_SL_3min[i]
}

let cumulativeOutcome_SL_10min = [ Outcome_SL_10min[0] ]
for (let i = 1; i < Outcome_SL_10min.length; i++) {
  cumulativeOutcome_SL_10min[i] = cumulativeOutcome_SL_10min[i-1] + Outcome_SL_10min[i]
}

let cumulativeOutcome_trendlineBreak = [ Outcome_trendlineBreak[0] ]
for (let i = 1; i < Outcome_trendlineBreak.length; i++) {
  cumulativeOutcome_trendlineBreak[i] = cumulativeOutcome_trendlineBreak[i-1] + Outcome_trendlineBreak[i]
}

let cumulativeOutcome_noChange = [ Outcome_noChange[0] ]
for (let i = 1; i < Outcome_noChange.length; i++) {
  cumulativeOutcome_noChange[i] = cumulativeOutcome_noChange[i-1] + Outcome_noChange[i]
}

const TradeDollar = pages.map(p => p.rows.values.reduce((tmp, curr) => tmp + ((curr.risk * curr.outcome)/10), 0)).values
const totalDollar = TradeDollar.reduce((tmp, curr) => tmp + curr, 0)

let cumulativeDollar = [ TradeDollar[0] ]
for (let i = 1; i < TradeDollar.length; i++) {
  cumulativeDollar[i] = cumulativeDollar[i-1] + TradeDollar[i]
}
dv.paragraph(`Total:  ${ Math.round(total * 100, 0)/100 } R or ${ Math.round(totalDollar * 100, 0)/10} $`)


const cumulativeChart = {
type: 'line',
data: {
	labels: TradeDate,
	datasets:[{
		label: 'R',
		data: cumulativeOutcome,
			borderColor: [
				'rgba(255, 99, 132, 1)'
			],
			borderWidth: 2,
			tension: 0.3,
		}, {
		label: '$',
		data: cumulativeDollar,
			borderColor: [
				'rgba(255, 99, 132, 0.2)'
			],
			borderWidth: 2,
			tension: 0.3,
		}, {
		label: '3min',
		data: cumulativeOutcome_SL_3min,
			borderColor: [
				'rgba(255, 199, 0, 0.7)'
			],
			borderWidth: 0.75,
			tension: 0.3,
			borderDash: [
				10,4,
			],
		}, {
		label: '10min',
		data: cumulativeOutcome_SL_10min,
			borderColor: [
				'rgba(50, 168, 107, 0.7)'
			],
			borderWidth: 0.75,
			tension: 0.3,
			borderDash: [
				10,4,
			],
		}, {
		label: 'TrendlineBreak',
		data: cumulativeOutcome_trendlineBreak,
			borderColor: [
				'rgba(148, 114, 235, 0.7)'
			],
			borderWidth: 0.75,
			tension: 0.3,
			borderDash: [
				10,4,
			],
		}, {
		label: 'noChange',
		data: cumulativeOutcome_noChange,
			borderColor: [
				'rgba(0, 162, 255, 0.7)'
			],
			borderWidth: 0.75,
			tension: 0.3,
			borderDash: [
				10,4,
			],
		}]
	},
	options:{
		scales: {
			myScale: {
			position: 'right',
			stacked: false,
			}
		},
		elements: {
			point: {
				radius: 0.75,
				hitRadius: 3,
				hoverRadius: 4
			}
		},
		events: ['click'],
		animation: false,
	}
}
window.renderChart(cumulativeChart, this.container)
In all of the relevant sections, try changing them by adding a hidden: true, after the label statement, so that the start of the section is:
data: {
	labels: TradeDate,
	hidden: true,
	datasets:[{
		label: 'R',
		data: cumulativeOutcome,
This seems to do the trick in a simple test of mine… ![]()
Great! Thanks … that worked excellent!
This topic was automatically closed 7 days after the last reply. New replies are no longer allowed.