Graph colourisation according to brain entropy


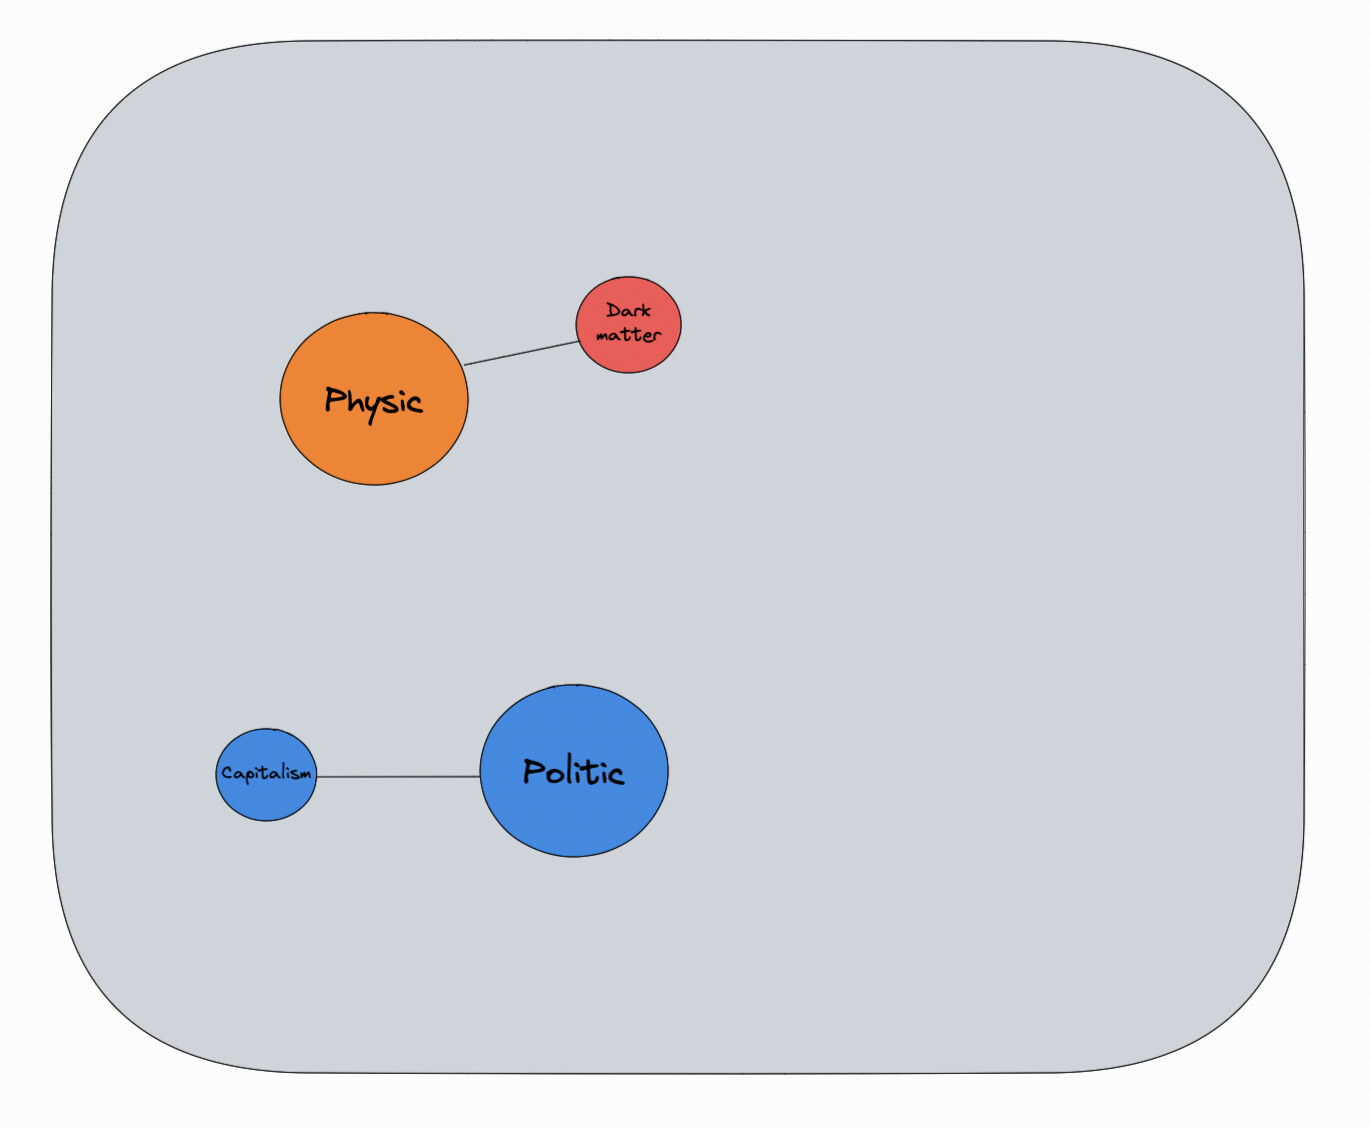
Let’s say I wrote a lot about “Dark matter” recently, which is connected to “Physic”, so these nodes are “hotter” while I didn’t write for a while on “Politic” and “Capitalism” so these are “colder”.

See the idea? As we talk about hot/cold data, here hot/cold thoughts, showing brain entropy :slight_smile:

20 Likes

Coloring in gradients according to new-old, popular-forgotten, multilinked-isolated, it would be fantastic I know

2 Likes

This concept about brain entropy in a graphic view is awesome. :star_struck:

2 Likes

I agree!

Can it be integrated in existing Obsidian graph? i’d pay for this