To reiterate your question, you want to create a line graph based upon data from journals, where each journal is named something like 2024-03-24-Samstag, and the criteria for the graph are:
- The labels (and range) is to be the last seven days (aka
xdimension) - One set of the
ydimension are completed tasks on that day for a given tag - If possible, add multiple set for the
ydimension for different tags
So in a super simplified world this could be presented in a table view as
| date | Tag1 | Tag 2 |
|---|---|---|
| 2024-03-20 | 0 | 8 |
| 2024-03-21 | 1 | 5 |
| 2024-03-22 | 2 | 0 |
| 2024-03-23 | 3 | 4 |
Since the completion date could be different from the daily note date containing that task, we can’t use that as the base for our queries. We can use the dates, but we do need to make the query only report the completed tasks related to our tags in the corresponding date range.
So to build the complete data set we’d need to do the following steps:
- Build a dictionary with the correct date range
- Build a task query listing completed tasks in our date range, limited to our tag set, grouped on the completion date, and then map that into an entry of the dictionary
- After that it should be smooth sailing to present the data in a chart
A debug query to display the counts
The query belows attempts to build a table out of completed task in the given date range listing matching tags, and the count of those tags. Try this and see if you can make it match your scenario after changing stuff in the first few lines:
```dataviewjs
// Define these according to your specifications
const myFolder = "ProjectOne" // Or whatever folder your tasks are in
const myDate = moment("2024-03-07")  // use moment() for today
const tag1name = "#tag1"
const tag2name = "#tag2"

// calculate some extra variables to use in queries
const endDate = moment("2024-03-07")
const startDate = endDate.clone().add(-6, "days")

dv.paragraph("Date range: " + startDate.format("YYYY-MM-DD") + " — " + endDate.format("YYYY-MM-DD"))

const taskCandidates = dv.pages('"' + myFolder + '"')
  .file.tasks
  .where(t => t.completed)
  .where(t => t.completion >= startDate && t.completion <= endDate)
  .mutate(t => {
    t.tag1 = t.tags.includes(tag1name) ? 1 : 0
    t.tag2 = t.tags.includes(tag2name) ? 1 : 0
  })
  .groupBy(t => t.completion)
  .mutate(r => {
    r.tag1 = r.rows.tag1.array().reduce((a, c) => a+c, 0)
    r.tag2 = r.rows.tag2.array().reduce((a, c) => a+c, 0)
  })
  .map(t => [t.rows.text, t.rows.section,  t.rows.completion, t.rows.tags, t.tag1, t.tag2])

dv.table(["text", "file.link", "completion", "tags", "tag1count", "tag2count"], taskCandidates)
```
Example output from my test vault
For my test vault, after loads of tampering with setup files this resulted in this output:
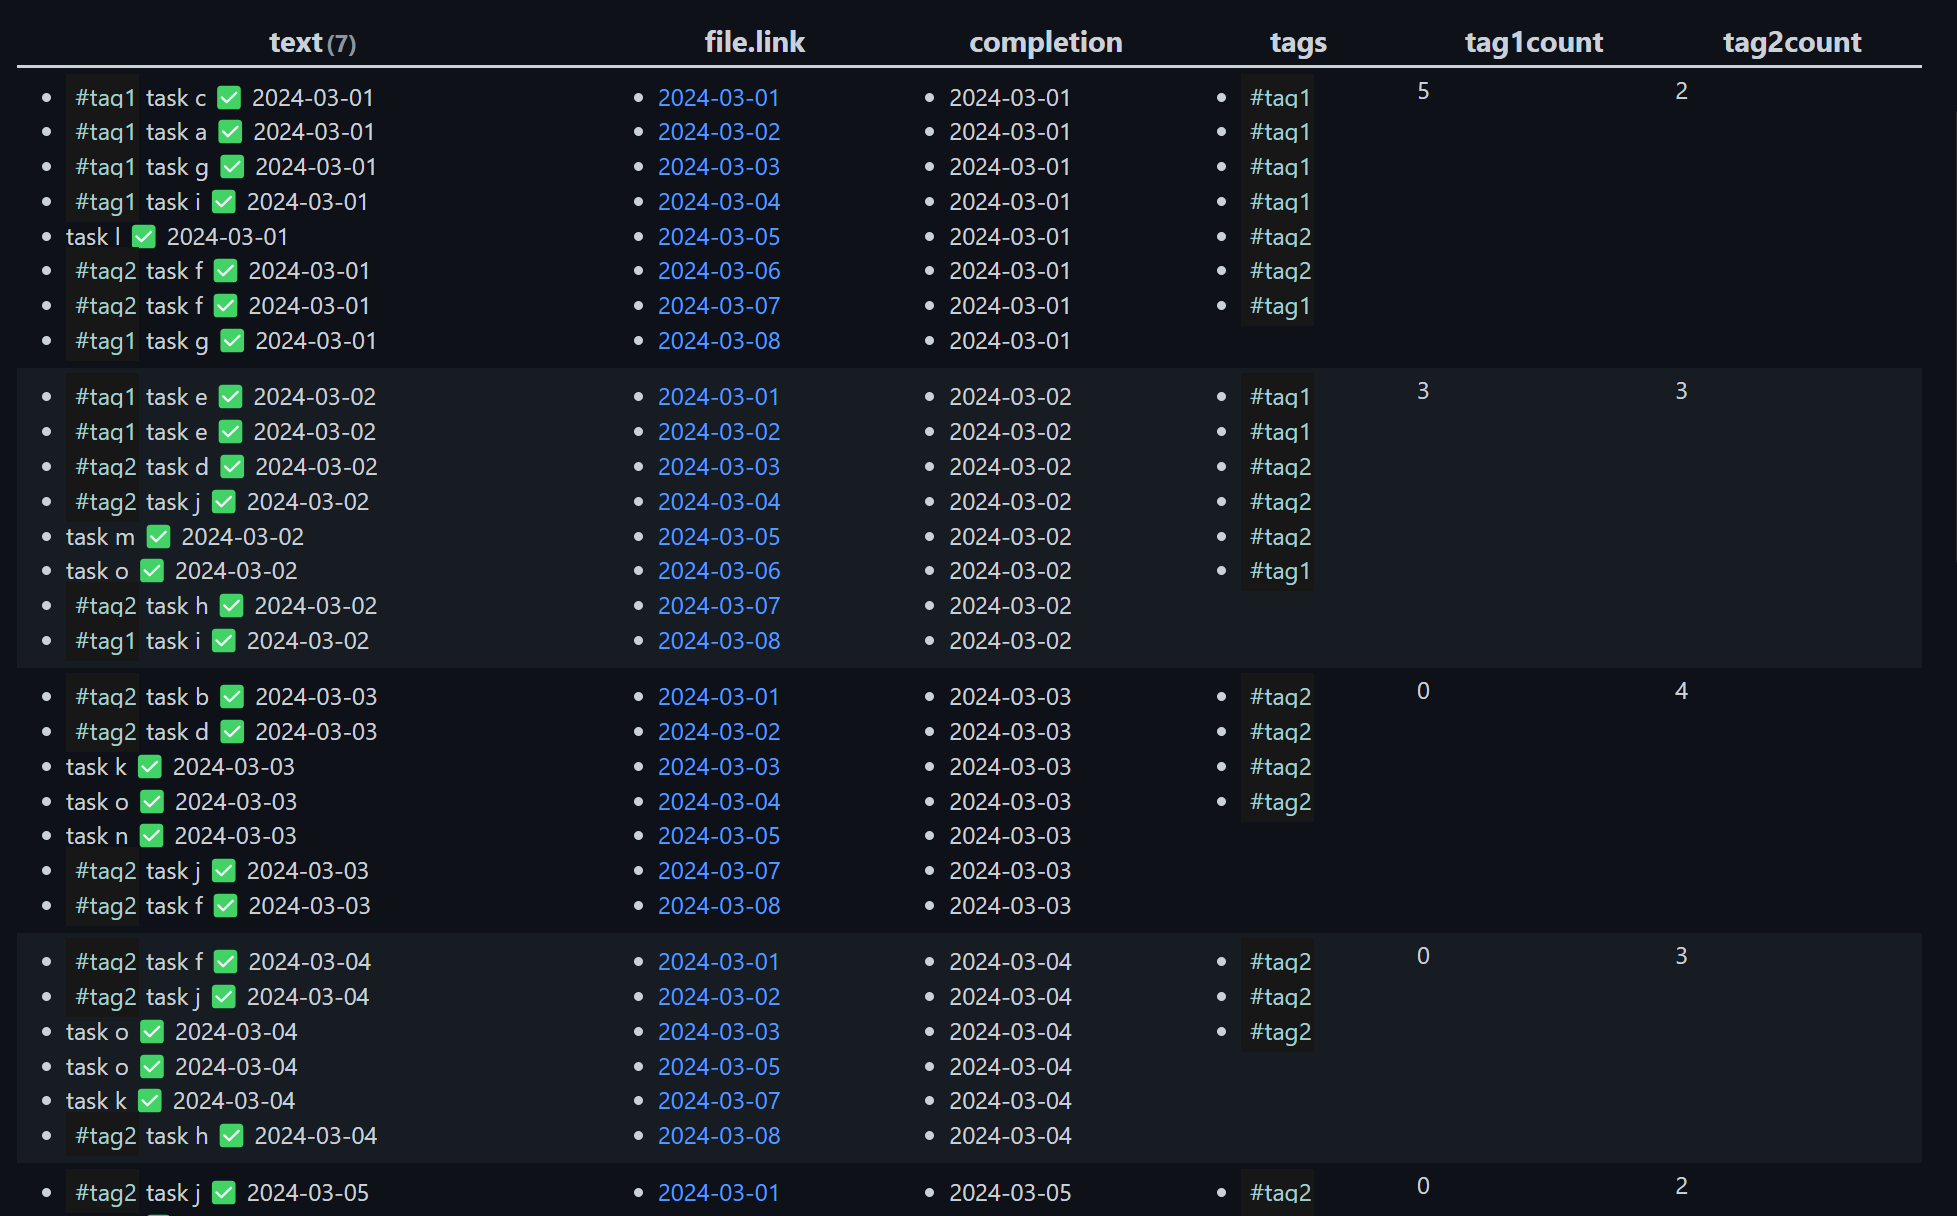
Here we can see the clear distinction between the file.link where the task was kept, and the completion date in the next column, and then which tags the completed tasks had and a count for each tag.
The linechart data
After you’ve fiddled around with the query above till you get something resembling my output, you can do the same kind of modifications to this script:
```dataviewjs
// Define these according to your specifications
const myFolder = "ForumStuff/f78/f78650"
const myDate = moment("2024-03-07")  // use moment() for today
const tag1name = "#tag1"
const tag2name = "#tag2"

// calculate some extra variables to use in queries
const endDate = moment("2024-03-07")
const startDate = endDate.clone().add(-6, "days")

dv.paragraph("Date range: " + startDate.format("YYYY-MM-DD") + " — " + endDate.format("YYYY-MM-DD"))

const lineChartData = {}
for (let i = startDate.clone(); i.isSameOrBefore(endDate); i.add(1, "day")) {
  lineChartData[i.format("YYYY-MM-DD")] = [0, 0]
}

const taskCandidates = dv.pages('"' + myFolder + '"')
  .file.tasks
  .where(t => t.completed)
  .where(t => t.completion >= startDate && t.completion <= endDate)
  .mutate(t => {
    t.tag1 = t.tags.includes(tag1name) ? 1 : 0
    t.tag2 = t.tags.includes(tag2name) ? 1 : 0
  })
  .groupBy(t => t.completion)
  .mutate(r => {
    r.tag1 = r.rows.tag1.array().reduce((a, c) => a+c, 0)
    r.tag2 = r.rows.tag2.array().reduce((a, c) => a+c, 0)
  })
  .where(r => r.tag1 || r.tag2)
  .forEach(r => lineChartData[r.key.toFormat("yyyy-MM-dd")] = [r.tag1, r.tag2])

dv.table(["key", "value"], Object.entries(lineChartData))


```
Example output from my test vault (again)
With the same files as above this displayed this table:
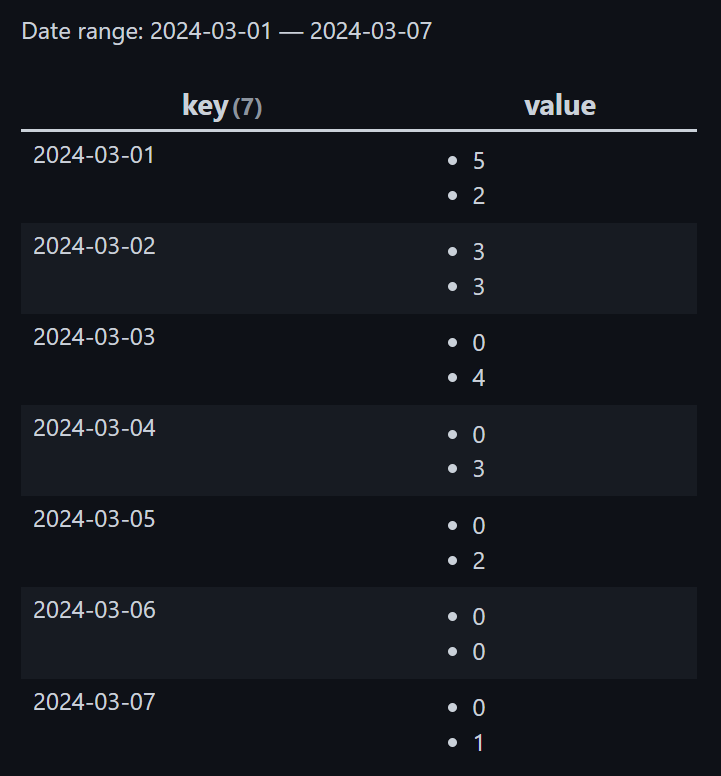
Note especially how the date 2024-03-06 has a double zero entry which it got from the initialization at the top of the query.
Using this data set the taskCandidates hopefully you’re able to present them into a linechart with multiple y-values. I’m going to call it a day now since it’s getting late, this took way too much time, and I’m still not sure if I’ve actually understood your requirements completely.
In any case, these scripts should hopefully show you some of the steps needed both to debug that you’ve got a proper data set to work with, and how to further manipulate that into something useful to chart afterwards.