So, I’ve managed to make a heap of progress with this - solving both of the key problems I had.
It does the array for each month as a separate line, and it provides the value ‘0’ for any missing files!
(Insane kudos to TheSoCalled and Part-Permissions, whose Q&As saved me)
I managed to render the graph
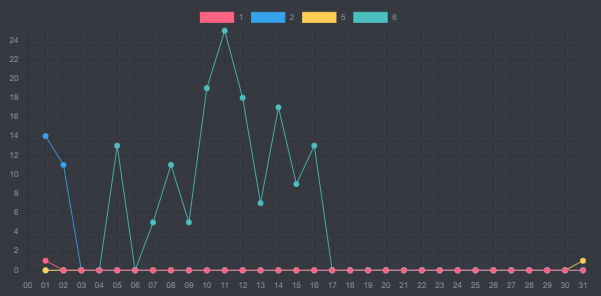
with this
var labels = ["00","01","02","03","04","05","06","07","08","09","10","11","12","13","14","15","16","17","18","19","20","21","22","23","24","25","26","27","28","29","30","31",];
var colors = [['#ff6384'],['#36a2eb'],['#ffce56'],['#4bc0c0'],['#9966ff'],['#ff9f40'],]
var datasets = [];

for(
	let group of dv
		.pages('"202 BuJo/202.12 Daily"')
		.where((page) => dv.func.contains(page.file.name, "2023-"))
		.where(p => p.fitness.meditation && p.date)
		.groupBy(p => (dv.date(p.date).toFormat("dd MMMM")))
		.sort(dm => dm.rows.date.first(), 'asc')
		.groupBy(dm => (dv.date(dm.rows.date.first()).month))
		.sort(d => d.key, 'asc')
	) {
		let lbl = group.key;
		let backCol = colors[datasets.length%colors.length];
		let bordCol = colors[datasets.length%colors.length];
		let bWidth = 1;

	let innerArray = [,0,0,0,0,0,0,0,0,0,0,0,0,0,0,0,0,0,0,0,0,0,0,0,0,0,0,0,0,0,0,0];
		group.rows.forEach(d => {
			let medTime = dv.array(d.rows).fitness.meditation.values;
			innerArray[d.rows.date.first().day] = medTime;
		})
		let da = {
			label: lbl,
			data: innerArray,
			backgroundColor: backCol,
			borderColor: bordCol,
			borderWidth: bWidth
		};
	datasets.push(da)
		}

	const chartData = {
		type: 'line',
		data: {labels: labels, datasets: datasets},
		options: {scales: {yAxis: {suggestedMin: 0, ticks: {stepSize: 1}}}
	}}

window.renderChart(chartData, this.container);
New Problems
However, I’ve now run into a couple of interesting (minor) issues:
1 - It relies on the metadata 'date', when I want to use file.name
Rather than being able to parse ‘file-name’ in innerArray[d.rows.date.first().day].
Ideally, I’d like it to work off file-name, because otherwise I’ll have to go back through All my daily notes to add the metadata.
(My files are titled in yyyy-mm-dd format, if not already mentioned)
2 - I want to relabel the months
They’re currently generated as the group.key, but I’d like to rename them ‘Jan’, ‘Feb’, etc.
I feel like there should just be a way to change the group.key rendering as a number and into plain-text?
3 - The x-axis currently needs to start at 00 instead of 01
If I used innerArray[d.rows.date.first().day-1] = medTime; (note the -1), I wouldn’t need the ‘00’ label on the x-axis.
However, it also wouldn’t show anything from the first two months?
4 - Values recorded at zero are treated the same as those missing
When I meditate more than 20 minutes, I currently mark it as ‘0’.
However, the current array displays all missing values as ‘0’, confusing the two sets.
If I leave the innerArray as [, , , …], it removes all fitness.meditation time that equal 0.
If I lower innerArray to [-1,-1,-1,…], all values entered at zero get reduced to that as well.
I don’t particularly want to go back through all my notes and replace them with something like 21, but is there anything that will actually deal with this?
Why did I need the two groupings?
This is less a problem and more something I noticed with the structure.
I managed to build a table that correctly grouped and ordered the information
(Based off DataviewJS Snippet Showcase - #241 by justdoitcc)
// GATHER PAGES
let pages = dv
	.pages('"202 BuJo/202.12 Daily"')
	.where((page) => dv.func.contains(page.file.name, "2023-"))
	.where(p => p.reading.card)
	.sort(p => p.file.name)

// GROUP
let groups = pages
	.groupBy(p => (dv.date(p.file.name).month))

// OUTPUT
for (let G1 of groups) {
    dv.header(2, G1.key);
    dv.table(
        ["Date", "Card"],
        G1.rows
            .map(p => [p.file.link, p.reading.card])
    );
}
But if I tried to use this in a line-graph
using this query
const pages = dv
	.pages('"202 BuJo/202.12 Daily"')
	.where((page) => dv.func.contains(page.file.name, "2023-"))
	.where(p => p.rfitness.meditation)
	.sort(p => p.file.name)
	.groupBy(p => (dv.date(p.file.name).month))

for(let G1 of pages) {
		let innerArray = [0,0,0,0,0,0,0,0,0,0,0,0,0,0,0,0,0,0,0,0,0,0,0,0,0,0,0,0,0,0];
		pages.forEach(d => {
			let medTime = dv.array(d.rows).fitness.meditation.values;
			innerArray[d.rows.file.name.first().day] = medTime;
		})
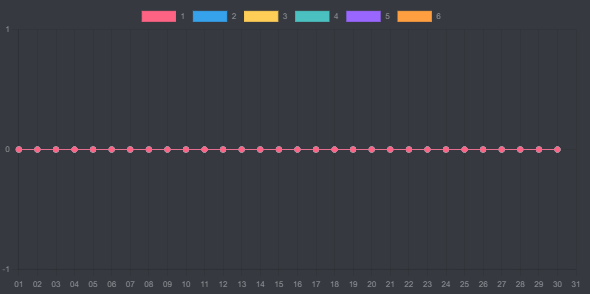
I’m mostly curious as to why it didn’t work? What am I missing about the structure?