Dataview: Function to get length of unique values OR using nested queries

Hello, I am trying to use Obsidian and Dataview to track my working hours by day and project. I am doing this by entering chunks of work into my daily notes like this:

e.g., in file “2022-11-22”

work:: meeting, 08:00, 09:30
work:: project1, 09:30, 12:15
work:: project1, 12:45, 14:15
work:: meeting, 14:15, 17:30

e.g., in file “2022-11-21”

work:: project2, 08:15, 12:15
work:: meeting, 13:00, 16:00

Tracking the hours themselves and summing them by project has been working great, but I cannot seem to figure out how to calculate a running total of how much overtime I have racked up.

The following table works to calculate overtime per day, assuming an 8h workday:

TABLE WITHOUT ID
	Date,
	round(sum(rows.Hours), 2) AS "Total Hours",
	round(sum(rows.Hours) - 8, 2) AS "Overtime"
FROM "_Daily notes"
WHERE work
FLATTEN work AS W
FLATTEN file.name AS Date
FLATTEN split(W, "\, ")[0] AS Project
FLATTEN split(W, "\, ")[1] AS Start
FLATTEN split(W, "\, ")[2] AS End
FLATTEN date(Date + "T" + End) AS Tend
FLATTEN date(Date + "T" + Start) AS Tstart
FLATTEN round((Tend - Tstart).hours, 2) AS Hours
GROUP BY Date

How do I go about summing up this “Overtime” column to get a total count?

Things I have tried

I searched the forums and found several questions asking about how to sum columns, but all the questions I saw asked about summing raw values. The solution in those cases was to construct a query that simply sums all raw values. In my case, that doesn’t work because I first have to perform an operation (subtract 8h) on already-grouped values (entries grouped by day), so I cannot just subtract 8h from each entry.

I have tried summing up all “work” entries across all daily notes and then subtracting [# days]*8 from that count. The problem is that I don’t know how to obtain the number of unique days. If I just take length(rows), it’s giving me the total number of entries, but that number is of course way too large since I usually have a bunch of entries per day. Is there some equivalent of length(unique(Date))?

I also tried taking the table above that’s grouped by day and adding a second GROUP BY statement (e.g., grouping by Overtime, by null, or by an arbitrary index). This gave me the error message Dataview: Every row during final data extraction failed with an error; first 3: No implementation found for 'null - number'

Alternatively, I have considered whether I could use the table above (overtime per day) as source input for a second table that sums across rows (yielding total overtime), but I also could not figure out how to do this yet.

What I’m trying to do

I am trying to group entries by date, then perform an operation on the daily values, and then sum the results across all dates. I would appreciate any hints!

This questions intrigued the programmer in me, and there could possibly be other solution to this more inline with DQL queries. I however changed it into DataviewJS query, and feed your original query into dv.query(), before I then proceeded to present the original result, and post-process the values of that query.

To make the overtime be more than 0 hours, I added another day to the dataset, and I ended up with this result:

image

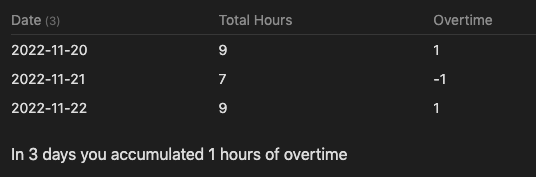
The code to generate it was this:

```dataviewjs

const dayByDay = await dv.query(`
TABLE WITHOUT ID
	Date,
	round(sum(rows.Hours), 2) AS "Total Hours",
	round(sum(rows.Hours) - 8, 2) AS "Overtime"
FROM "ForumStuff/f48105 Overtime query"
WHERE work
FLATTEN work AS W
FLATTEN file.name AS Date
FLATTEN split(W, "\, ")[0] AS Project
FLATTEN split(W, "\, ")[1] AS Start
FLATTEN split(W, "\, ")[2] AS End
FLATTEN date(Date + "T" + End) AS Tend
FLATTEN date(Date + "T" + Start) AS Tstart
FLATTEN round((Tend - Tstart).hours, 2) AS Hours
GROUP BY Date
`)

// Look at this in Developer Tools
console.log(dayByDay)

if (dayByDay.successful) {
  // Present original table
  dv.table(dayByDay.value.headers, dayByDay.value.values)

  // Calculate extra stuff based upon table 
  let noOfDays = 0
  let totOvertime = 0
  for (let day of dayByDay.value.values) {
    noOfDays += 1
    totOvertime += day[2]
  }
  dv.span(`In ${noOfDays} days you accumulated ${totOvertime} hours of overtime`)
} else {
  dv.span('Day by day query failed')
}
```

The line with console.log(dayByDay) can be removed, but I left in as I used that for debugging within Developer tools to see what was actually returned from the dv.query().

My code does the following:

  1. Execute your original query (with a slightly different from part to accommodate my setup)
  2. Display the debug output
  3. If successful run of the query
    3.1. Display original result using dv.table()
    3.2 Loop over the values of each row in the table, and increase number of days, and accumulate the overtime
    3.3 Display the days and overtime calculations
  4. If not a successful run, just state it

The code is not optimal, and you could for example simply take the length of the dayByDay.value.values array to get number of days, but it shows some of the possibilities available when post-processing a query within DataviewJS.

Hope this helps, at least I had fun doing it!
Holroy

2 Likes

Topic

Summary
  • How to sum up the Overtime from the files with the case_DVIF_DSS structure?

Test

Summary
  • dataview: v0.5.55

Input

Summary

dictionary files:

  • Location: “100_Project/02_dataview/Q79_SumOvertime/Q79_test_data”

folder: 03

  • filename : 1976-03-01
---
Date: 1976-03-01
---
#Project/P03

work:: meeting, 08:00, 09:30
work:: project1, 09:30, 12:15
work:: project1, 12:45, 14:15
work:: meeting, 14:15, 17:30


folder: 04

  • filename : 1976-04-01
---
Date: 1976-04-01
---
#Project/P04

work:: project2, 08:15, 12:15
work:: meeting, 13:00, 16:00


folder: 05

  • filename : 1976-05-01
---
Date: 1976-05-01
---
#Project/P05

work:: project2, 08:15, 12:15
work:: meeting, 13:00, 16:00
work:: meeting, 16:00, 18:00


DQL10_sum_Overtime_with_using_groupBy_once_and_TABLE

Summary

Main DQL

Code Name Data type Group By Purposes Remark
DQL10
_sum_Overtime
_with_using
_groupBy_once
_and_TABLE
Overtime:
a number
yes
(once)
1.To filter by work
2.To FLATTEN work AS W
3.To define seven field variables like Date, Project, Start, End, Tend, Tstart and Hours
4.To group by Date
5.To define two field variables like totHours and totOvertime
6.To display the result as a table
Note:
Require the files with the case_DVIF_DSS structure

The DQL10 is based on fii’s DQL.

Code DQL10_sum_Overtime_with_using_groupBy_once_and_TABLE

Summary_code
title: DQL10_sum_Overtime_with_using_groupBy_once_and_TABLE =>1.To filter by `work` 2.To FLATTEN work AS W 3.To define seven field variables like `Date`, `Project`, `Start`, `End`, `Tend`, `Tstart` and `Hours` 4.To group by Date 5.To define two field variables like `totHours` and `totOvertime` 6.To display the result as a table
collapse: close
icon: 
color: 
```dataview
TABLE WITHOUT ID
	  Date AS "Date",
	  totHours AS "Total Hours",
	  totOvertime AS "Overtime"
    
FROM "100_Project/02_dataview/Q79_SumOvertime/Q79_test_data"

WHERE work
FLATTEN work AS W

FLATTEN file.name AS Date
FLATTEN split(W, "\, ")[0] AS Project
FLATTEN split(W, "\, ")[1] AS Start
FLATTEN split(W, "\, ")[2] AS End
FLATTEN date(Date + "T" + End) AS Tend
FLATTEN date(Date + "T" + Start) AS Tstart
FLATTEN round((Tend - Tstart).hours, 2) AS Hours

GROUP BY Date
FLATTEN round(sum(rows.Hours), 2) AS totHours
FLATTEN round(sum(rows.Hours) - 8, 2) AS totOvertime


```

Screenshots(DQL10):


DQL20_sum_Overtime_with_using_groupBy_twice_and_TABLE

Summary

Main DQL

Code Name Data type Group By Purposes Remark
DQL20
_sum_Overtime
_with_using
_groupBy_twice
_and_TABLE
Overtime:
a number
yes
(twice)
1.To filter by work
2.To FLATTEN work AS W
3.To define seven field variables like Date, Project, Start, End, Tend, Tstart and Hours
4.To group by Date
5.To define two field variables like totHours and totOvertime
6.To GROUP BY true
7.To display the result as a table
Note:
Require the files with the case_DVIF_DSS structure

The DQL20 is based on the DQL10 in the following topic.
- Solutions

Code DQL20_sum_Overtime_with_using_groupBy_twice_and_TABLE

Summary_code
title: DQL20_sum_Overtime_with_using_groupBy_twice_and_TABLE =>1.To filter by `work` 2.To FLATTEN work AS W 3.To define seven field variables like `Date`, `Project`, `Start`, `End`, `Tend`, `Tstart` and `Hours` 4.To group by Date 5.To define two field variables like `totHours` and `totOvertime` 6.To GROUP BY true 7.To display the result as a table
collapse: close
icon: 
color: 
```dataview
TABLE WITHOUT ID
	    rows.Date AS "Date",
	    rows.totHours AS "Total Hours",
	    rows.totOvertime AS "Overtime",
      sum(rows.totOvertime) AS "Total Overtime"
    
FROM "100_Project/02_dataview/Q79_SumOvertime/Q79_test_data"

WHERE work
FLATTEN work AS W

FLATTEN file.name AS Date
FLATTEN split(W, "\, ")[0] AS Project
FLATTEN split(W, "\, ")[1] AS Start
FLATTEN split(W, "\, ")[2] AS End
FLATTEN date(Date + "T" + End) AS Tend
FLATTEN date(Date + "T" + Start) AS Tstart
FLATTEN round((Tend - Tstart).hours, 2) AS Hours

GROUP BY Date
FLATTEN round(sum(rows.Hours), 2) AS totHours
FLATTEN round(sum(rows.Hours) - 8, 2) AS totOvertime

GROUP BY true

```

Screenshots(DQL20):


Reference

Summary

Q24_SumDuration: DQL10


1 Like

@holroy @justdoitcc Wow, thank you both so much for your creative solutions! I didn’t know you could post-process a DQL query with js or how to properly combine two GROUP BY statements so I’m learning a lot. This gives me approaches to play with, thanks.

This topic was automatically closed 7 days after the last reply. New replies are no longer allowed.