Bar Chart with dataviewjs

Things I have tried

Searched the obsidian forum.

What I’m trying to do

With the help of Dataview & Obsidian Charts, I’m trying to draw a bar chart for each month.

The whole data is whithin the single page, ie, current page.
And the format is like this.

date:: 2023-01-03
score:: 8

date:: 2023-01-04
score:: 7

date:: 2023-01-31
score:: 9

date:: 2023-02-03
score:: 6

date:: 2023-02-04
score:: 7

date:: 2023-02-15
score:: 5

I’d like to draw bar chart something sililar to the graph in DataviewJS and Charts: split by frontmatter variable ("Medium")

The difference is that X-axis should have a value from 1st day to last day of the month with Y-axis of scores.
For the missing date, it woudl be nice if they have a default ‘0’ score value.

I guess that there should be 12 bar charts for a year at the end of the year.

If the data is fixed or if the data is contained all within one note, you could try this with the Charts plugin which here uses dataview :

test:: First Test
mark:: 6

const data = dv.current()

dv.paragraph(`\`\`\`chart
    type: bar
    labels: [${data.test}]
    series:
    - title: Grades
      data: [${data.mark}]
\`\`\``)

The problem I was having (in the thread you linked) was that I have my data spread out over a lot of different notes so Dataview, etc. need to check all those notes and compile the data somewhere else.

Does this help?

Thank you for your reply.

What I want to do is to monitor the daily progress with the bar chart even in days of having no scores.
So, in the January bar chart, there should be 31 bars with the default ‘0’ scores for the absent(missing?) dates.

Yeah, I can’t figure that out, sorry. Hope someone else can help.

All those fields are linked to the scope of the page, meaning that you don’t have any link between the date and the score, other than they randomly being at the same order most of the time.

You’re much better suited for the task at hand if you switch to a list variant, like:

- [date:: 2023-01-03] [score:: 7]
- [date:: 2023-01-04] [score:: 7]

In addition to fulfill the request on showing the entire month, I think you’ll need dataviewjs to build a little loop for all days of current month.

I’ve not got time today to write it up, as I’m on work and on mobile. Sorry.

Ps! What is the name of the current file? How do you know which month it is? Just from the date fields?

Thank you for your kind answer.

Your suggestion is quite intuitive and clean. Another thing to learn today.

First of all, I had a bit of fun trying to imagine how to do such a query to get the entire month displayed using only a DQL query, and here is the result:

testdate:: 2023-02-22

```dataview
TABLE WITHOUT ID testdate, mDay, dayInMonth, Score
      
FLATTEN ["01", "02", "03", "04", "05", "06", "07", "08", "09", 
       10, 11, 12, 13, 14, 15, 16, 17, 18, 19, 
       20, 21, 22, 23, 24, 25, 26, 27, 28, 29,
       30, 31] as mDay
FLATTEN date(dateformat(testdate, "yyyy-MM-") + mDay) as dayInMonth
FLATTEN default(map(
    filter(file.lists, 
           (L) => L.date = dayInMonth),
    (M) => M.score)[0], 0) as Score
WHERE file.name = this.file.name 
WHERE dayInMonth.month = testdate.month
```

Based on the testdate this will generate all days of that month, and show a corresponding entry for the score field. The top of this list displays as:

However, this is not directly related to your request, and I just present it for a little bit of fun (strange sense of humour, I know), and for posterity to see a somewhat interesting “for loop” done in DQL query. Do note the usage of default on the mapped value, to give an alternate value if there is no score defined for that particular date.

Now I’ll focus to actually give you a proper answer for your request in my next post (in hopefully a few hours)

Scratch a few hours, it was easier than expected:

test-data:: 2023-01-22

```dataviewjs
let labelset  = []
let dataset = []
let scores = {}
const consoleDebug = true

if (consoleDebug) console.log(`\n\n\n*** New run (${ dv.current().file.name }) \n\n\n`)

// Collate all the scores
dv.current()
  .file.lists
  .where(i => i.score && i.date)
  .forEach(s => {
    if ( consoleDebug ) console.log("s.date\n", s.date)
    if ( consoleDebug ) console.log("s.score\n", s.score)
    
    scores[s.date.toFormat("yyyy-MM-dd")] = s.score
  })

if ( consoleDebug ) console.log("scores\n", scores)

// Find current month
const baseDate = dv.current().testdate
const daysInMonth = baseDate.daysInMonth
const baseMonthPrefix = baseDate.toFormat("yyyy-MM-")

// Build the full month of labels and data
for (let i = 1; i <= daysInMonth; i++) {
  const dd = i < 10 ? "0" + i : i.toString()
  const mDay = baseMonthPrefix + dd
  labelset.push(dd) // or .push( mDay ) for full date
  if (mDay in scores) 
    dataset.push( scores[mDay] )
  else
    dataset.push( 0 )
}

if ( consoleDebug ) console.log("dataset\n", dataset)

// Build the graph
dv.paragraph(`
~~~chart
  type: bar
  labels: [${ labelset }]
  series:
  - title: Grades
    data: [${ dataset }]
~~~`)
```

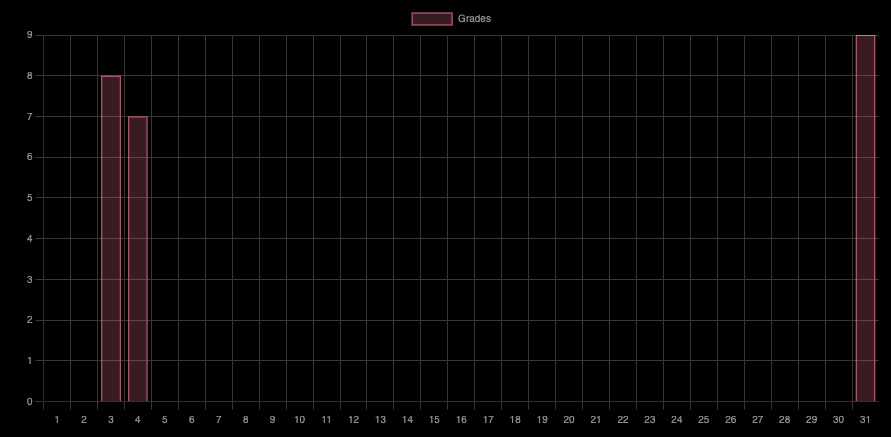
Produces this output:

Maybe some explanations are in order:

  • The script relies on the date and score to be in lists, so it starts out with collating (in my case) from the current file, and stores this locally in scores for later retrieval. I don’t bother limitting this to the actual month, but that could (and should possibly) be done
  • I then get the date for which this graph is to be shown. This could be the dv.current().file.name (if that’s in the YYYY-MM-DD format), or from a field, like testdata. Based on this date, I simply pull out how many dates there are in this month, by doing .daysInMonth, and I set a prefix used later for building the labels (and the key for scores). Note: in the toFormat we’re using the luxon date format tokens (see this for some rambling about date token formats)
  • Then we simply do a for loop to build all the labels, and pull out the scores as needed, for the entire month
  • Before finally we present the bar chart

Some more adaption to the chart should possibly be done, like including the month we’re listing (or match “grades” vs “scores”?), and give a title to the graph, and so on. That’s left to the reader. If you want the full date on each column, change the .push(dd) to .push(mDay).

Thak you for your code, kind explanations and time.

This is exactly what I want to get.

This topic was automatically closed 7 days after the last reply. New replies are no longer allowed.